Set environment
Code
suppressMessages (suppressWarnings (source ("../run_config_project_sing.R" )))show_env ()
You are working on        Singularity: singularity_proj_encode_fcc
BASE DIRECTORY (FD_BASE): /data/reddylab/Kuei
REPO DIRECTORY (FD_REPO): /data/reddylab/Kuei/repo
WORK DIRECTORY (FD_WORK): /data/reddylab/Kuei/work
DATA DIRECTORY (FD_DATA): /data/reddylab/Kuei/data

You are working with      ENCODE FCC
PATH OF PROJECT (FD_PRJ): /data/reddylab/Kuei/repo/Proj_ENCODE_FCC
PROJECT RESULTS (FD_RES): /data/reddylab/Kuei/repo/Proj_ENCODE_FCC/results
PROJECT SCRIPTS (FD_EXE): /data/reddylab/Kuei/repo/Proj_ENCODE_FCC/scripts
PROJECT DATA    (FD_DAT): /data/reddylab/Kuei/repo/Proj_ENCODE_FCC/data
PROJECT NOTE    (FD_NBK): /data/reddylab/Kuei/repo/Proj_ENCODE_FCC/notebooks
PROJECT DOCS    (FD_DOC): /data/reddylab/Kuei/repo/Proj_ENCODE_FCC/docs
PROJECT LOG     (FD_LOG): /data/reddylab/Kuei/repo/Proj_ENCODE_FCC/log
PROJECT REF     (FD_REF): /data/reddylab/Kuei/repo/Proj_ENCODE_FCC/references
Set global variables
Code
= "encode_chromatin_states"
Import data
Code
= TXT_FOLDER_REGION= file.path (FD_RES, "region" , txt_folder)= dir (txt_fdiry)for (txt in vec){cat (txt, " \n " )}
K562.hg38.cCREs.silencer_rest.bed.gz
K562.hg38.cCREs.silencer_starr.bed.gz
K562.hg38.ENCSR365YNI.ENCFF106BGJ.ChromHMM.simplified.bed.gz
K562.hg38.ENCSR913HQX.ENCFF286VQG.cCREs.simplified.bed.gz
summary
Code
= TXT_FOLDER_REGION= file.path (FD_RES, "region" , txt_folder, "summary" )= dir (txt_fdiry)for (txt in vec){cat (txt, " \n " )}
description.tsv
K562.hg38.ENCSR913HQX.ENCFF286VQG.cCREs.label2name.bed.gz
K562.hg38.ENCSR913HQX.ENCFF286VQG.cCREs.label2name.PLS_ELS.bed.gz
metadata.label.tsv
Code
### set file path = TXT_FOLDER_REGION= file.path (FD_RES, "region" , txt_folder, "summary" )= "description.tsv" = file.path (txt_fdiry, txt_fname)### read table = read_tsv (txt_fpath, show_col_types = FALSE )### assign and show = dat= dat$ Namefun_display_table (head (dat))
Chrom
Name of the chromosome
ChromStart
The starting position of the feature in the chromosome
ChromEnd
The ending position of the feature in the chromosome
Name
Name given to a region; Use '.' if no name is assigned.
Group
Type of chromatin states annotaiton
Label
cCREs/ChromHMM labels
Code
### set file path = TXT_FOLDER_REGION= file.path (FD_RES, "region" , txt_folder)= "K562.hg38.ENCSR913HQX.ENCFF286VQG.cCREs.simplified.bed.gz" = file.path (txt_fdiry, txt_fname)### read table = read_tsv (txt_fpath, col_names = vec_txt_cname, show_col_types = FALSE )### assign and show = datfun_display_table (head (dat))
chr1
10033
10250
EH38E2776516
cCREs
Low-DNase
chr1
10385
10713
EH38E2776517
cCREs
Low-DNase
chr1
16097
16381
EH38E3951272
cCREs
Low-DNase
chr1
17343
17642
EH38E3951273
cCREs
Low-DNase
chr1
29320
29517
EH38E3951274
cCREs
Low-DNase
chr1
66350
66509
EH38E3951275
cCREs
Low-DNase
Code
### set file path = TXT_FOLDER_REGION= file.path (FD_RES, "region" , txt_folder)= "K562.hg38.ENCSR365YNI.ENCFF106BGJ.ChromHMM.simplified.bed.gz" = file.path (txt_fdiry, txt_fname)### read table = read_tsv (txt_fpath, col_names = vec_txt_cname, show_col_types = FALSE )### assign and show = datfun_display_table (head (dat))
chr1
0
16000
Quies
ChromHMM
Quies
chr1
16000
16200
TxWk
ChromHMM
TxWk
chr1
16200
17400
Quies
ChromHMM
Quies
chr1
17400
17600
TxWk
ChromHMM
TxWk
chr1
17600
118400
Quies
ChromHMM
Quies
chr1
118400
120200
Enh1
ChromHMM
Enh1
Explore data
Summary of region length
Code
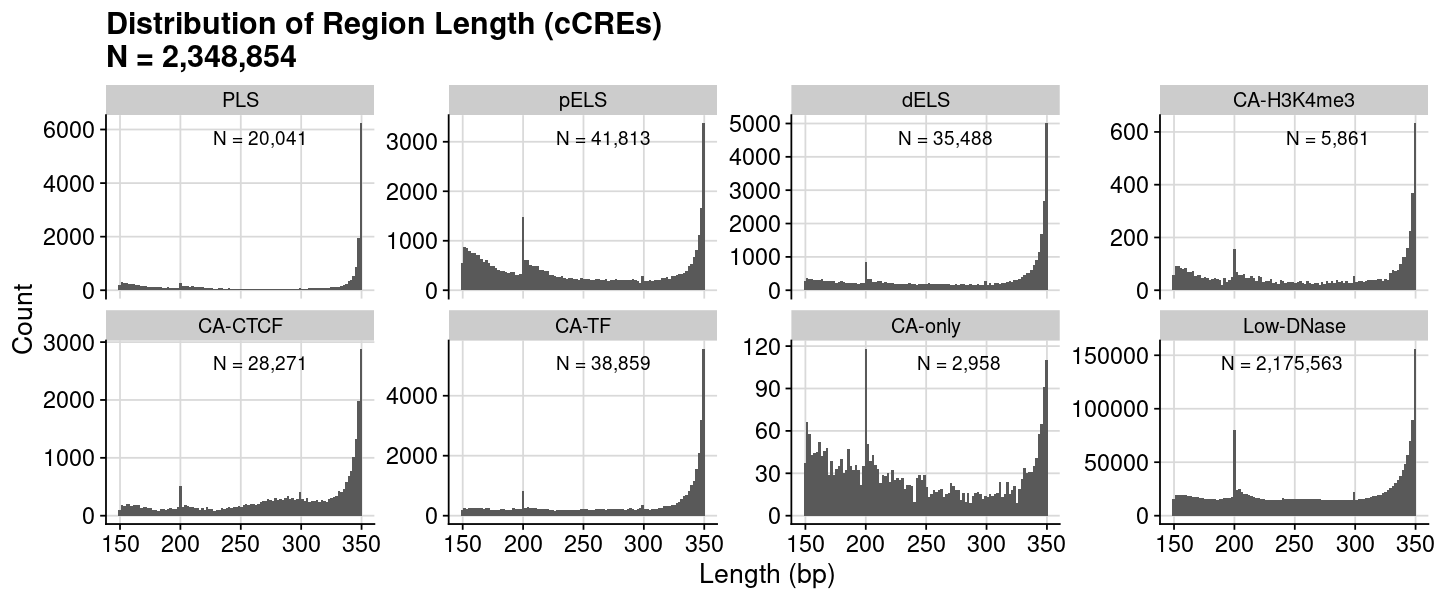
= dat_region_ccres= dat %>% dplyr:: mutate (Length = ChromEnd - ChromStart)= dat$ Lengthcat ("#{Region} =" , nrow (dat), " \n " )summary (vec)= quantile (vec, probs= 0.9 , na.rm= TRUE )cat ("90th percentile" , num, " \n " )
   Min. 1st Qu.  Median    Mean 3rd Qu.    Max.
  150.0   205.0   273.0   267.1   335.0   350.0
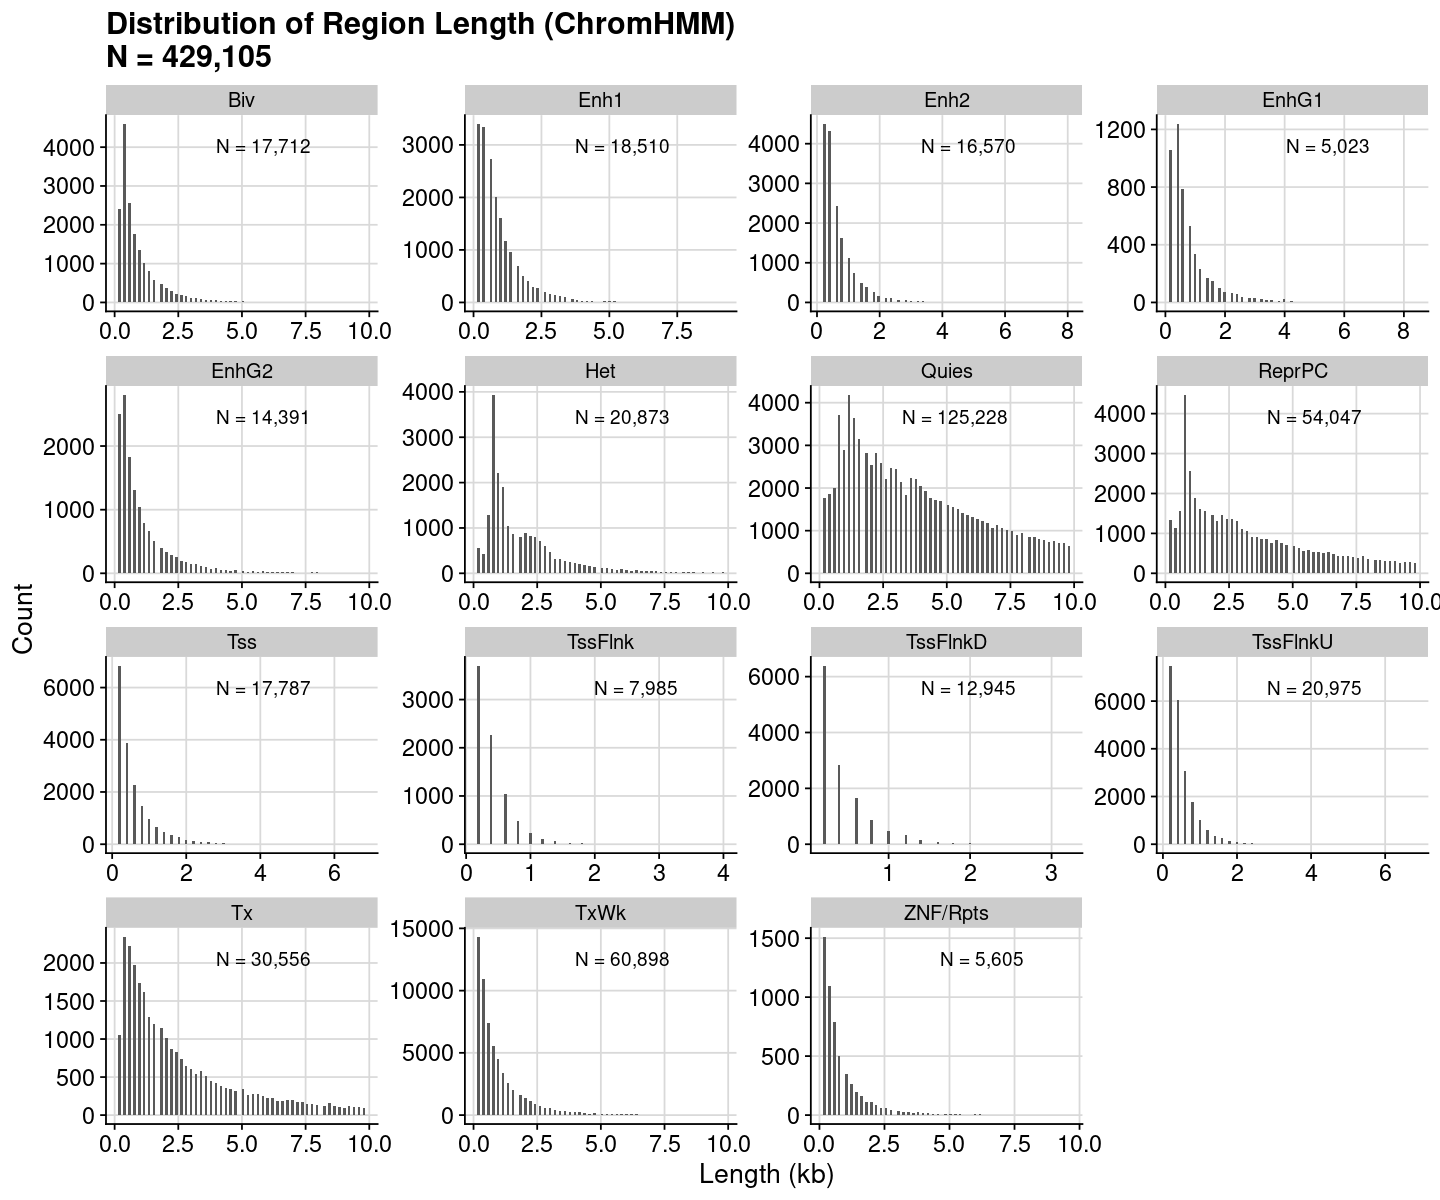
Code
= dat_region_chromhmm= dat %>% dplyr:: mutate (Length = ChromEnd - ChromStart)= dat$ Lengthcat ("#{Region} =" , nrow (dat), " \n " )summary (vec)= quantile (vec, probs= 0.9 , na.rm= TRUE )cat ("90th percentile" , num, " \n " )
    Min.  1st Qu.   Median     Mean  3rd Qu.     Max.
     200      400     1200     7197     4400 45489200
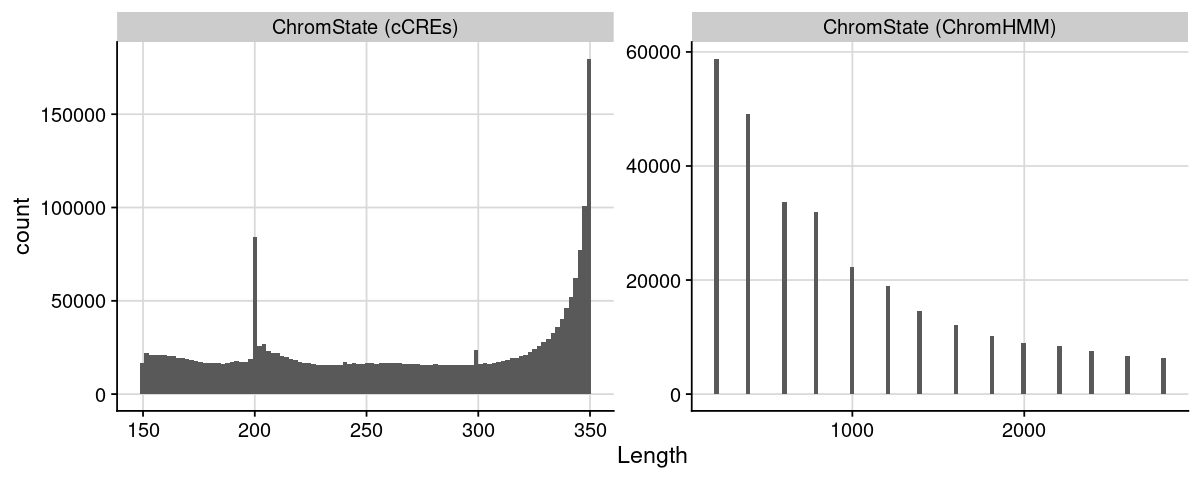
Distribution of region length
Code
= list ("ChromState (cCREs)" = dat_region_ccres,"ChromState (ChromHMM)" = dat_region_chromhmm= bind_rows (lst, .id = "Label" )= dat %>% :: mutate (Length = ChromEnd - ChromStart) %>% :: filter (Length < 3000 )= ggplot (dat, aes (x = Length)) + geom_histogram (bins = 100 ) + theme_cowplot () + background_grid () + facet_wrap (~ Label, scales = "free" )options (repr.plot.height= 4 , repr.plot.width= 10 )print (gpt)