Open chromatin regions
Applying MACS on ATAC-STARR-seq input libraries
To define the accessible regions used for this studies, we applied the MACS peak calling at the ATAC-STARR input libraries.
The input libraries of ATAC-STARR libraries were built on the genomic fragments after Tn5 digestion. The input library was transfected in K562 cell for testing regulatory activities.
The sequencing of input libraries results in X billions of unique fragments across six technical replicates.
The MACS tool was applied to ASTARR input libraries to acquire the chromatin accessible regions. This process was conducted by Alex.
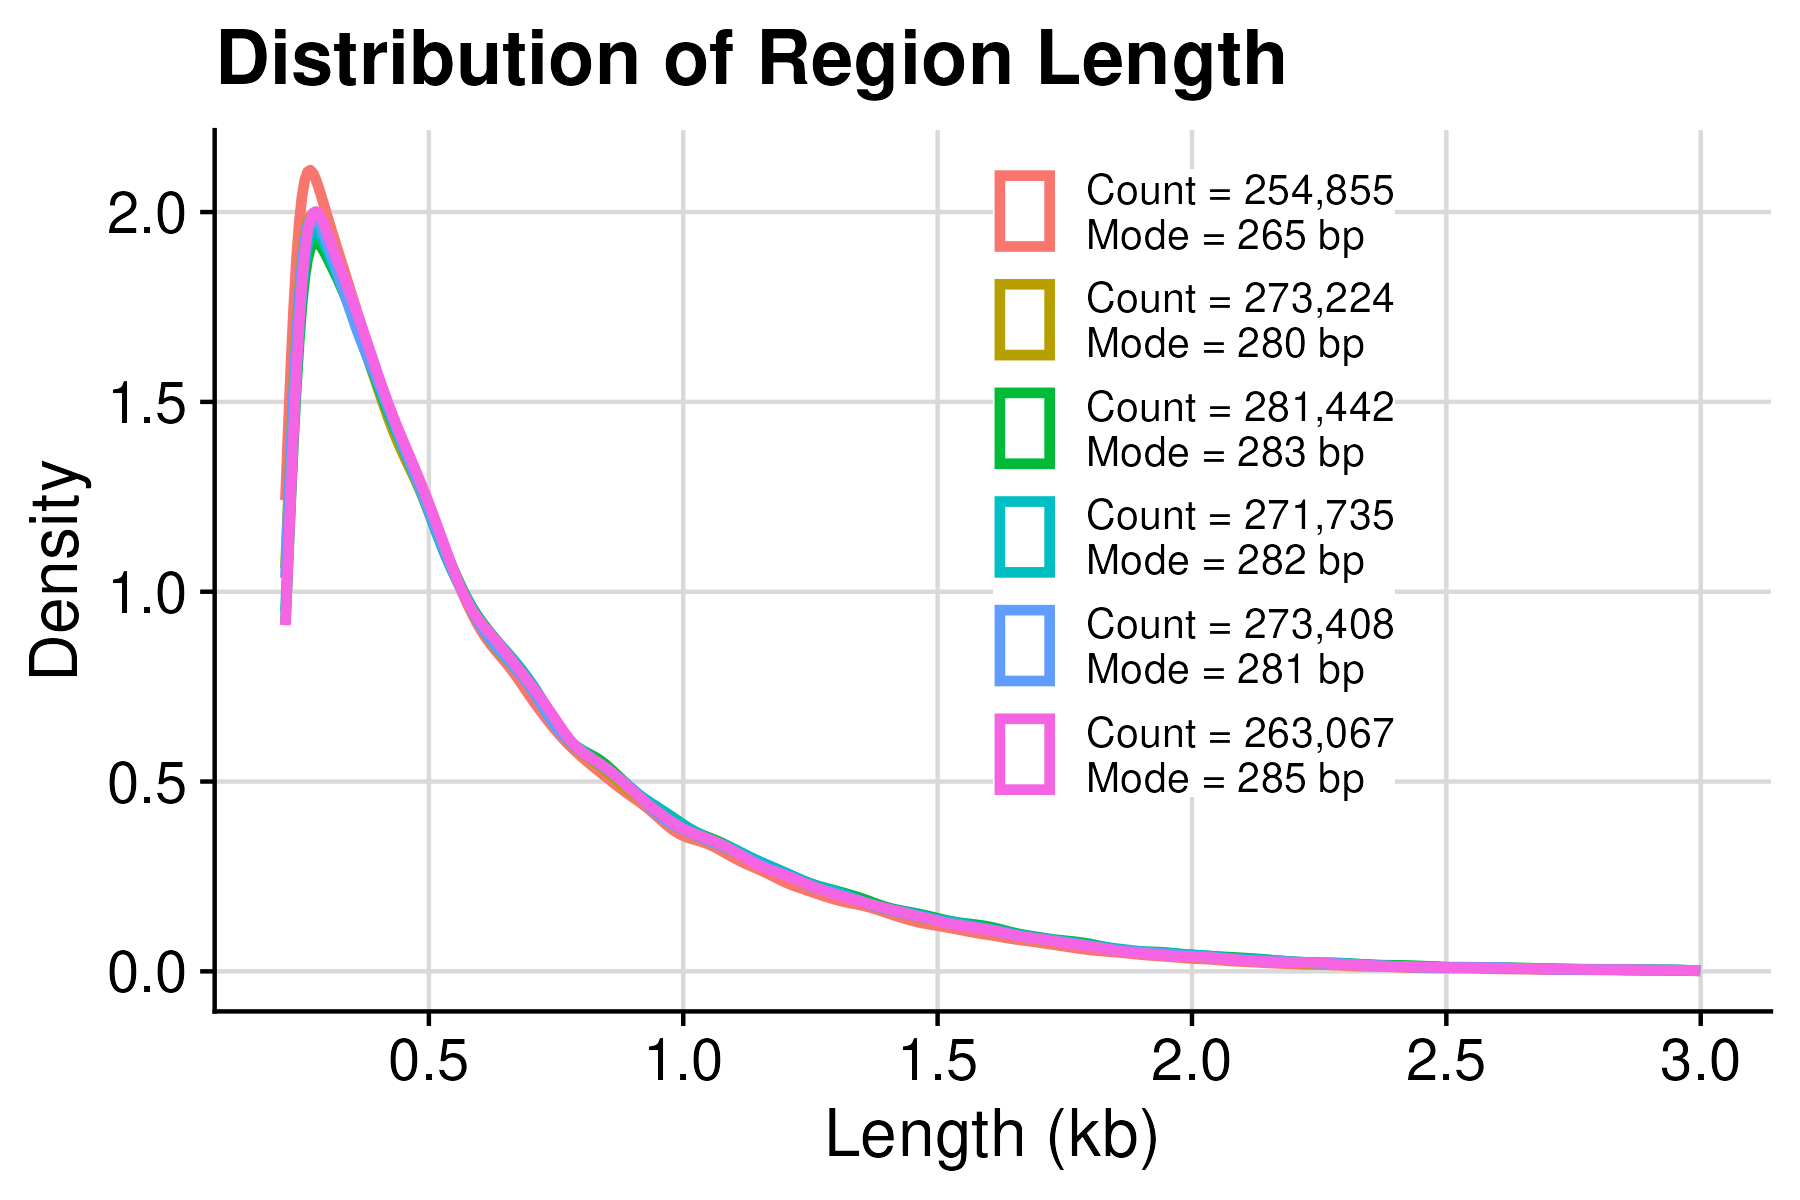
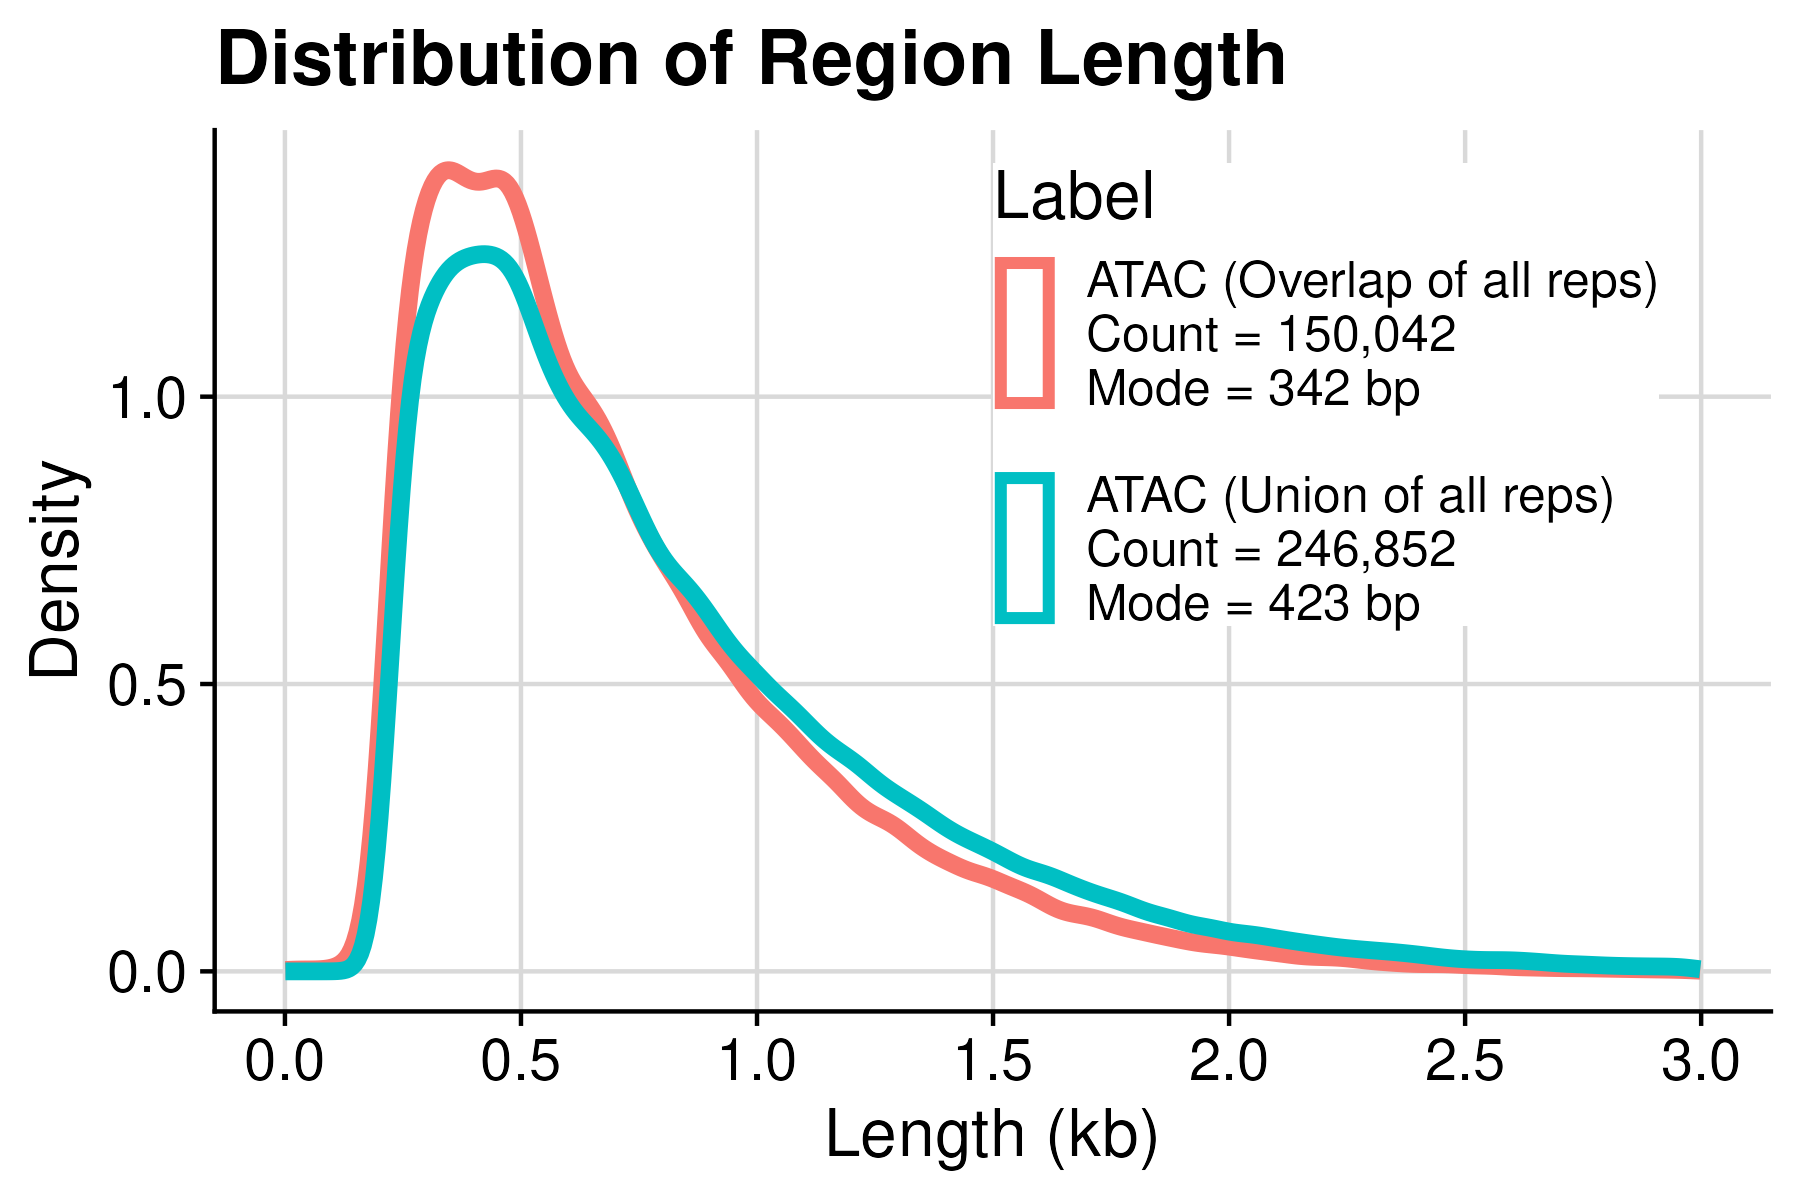
There are two sets of accessible regions in this - less stringent region set: union of base pairs across replicates - more stringent region set: overlap/interaction of base pairs across all replicates, only the base pairs that exist in all replicates are retained
Note: write the description of length using Mode and IQR, 90 percentile - Union: Mode = 422 bp, Median = 800 bp, 1031-435 = 596 bp, 90 percentile = 1475 bp - Overlap: Mode = 342 bp, Median = 597 bp, 909-401 = 508 bp, 90 percentile) = 1293 bp
Detail numbers
ATAC (Union)
#{Region} = 246,852
Length (Min) = 218 bp
Length (1st Q) = 435 bp
Length (Median) = 665 bp
Length (Mean) = 800 bp
Length (Mode) = 422 bp
Length (3rd Q) = 1031 bp
Length (Max) = 6251 bp
Length (90 percentile) = 1475 bp

ATAC (Overlap or intersection)
#{Region} = 150,042
Length (Min) = 1 bp
Length (1st Q) = 401 bp
Length (Median) = 597 bp
Length (Mean) = 712 bp
Length (Mode) = 342 bp
Length (3rd Q) = 909 bp
Length (Max) = 6172 bp
Length (90 percentile) = 1293 bp
Distribution of length
[TODO] Use figure panel to include the distribution of GC content and accessibility (TPM) https://quarto.org/docs/authoring/figures.html
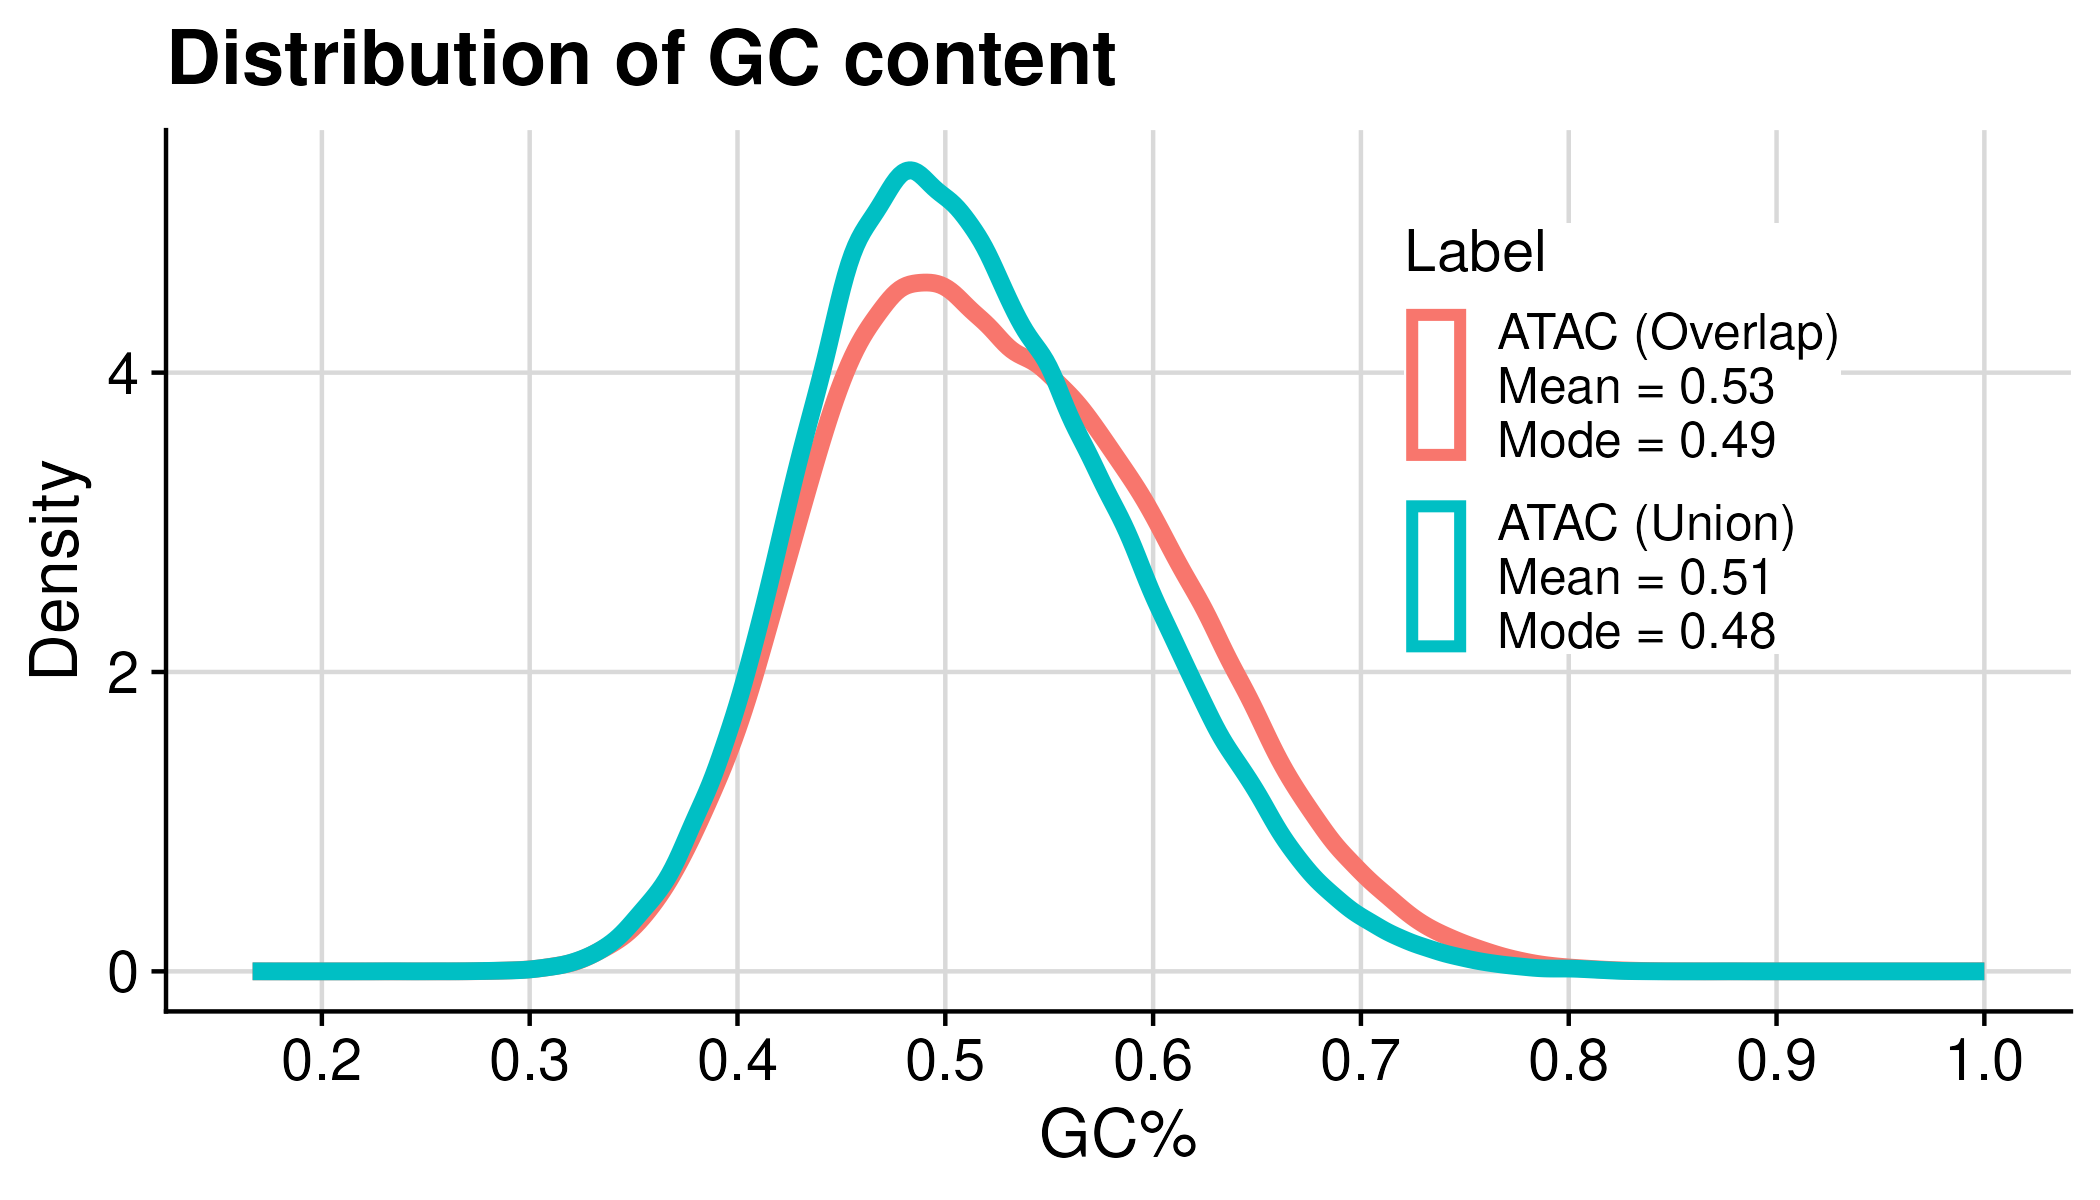
Distribution of GC content
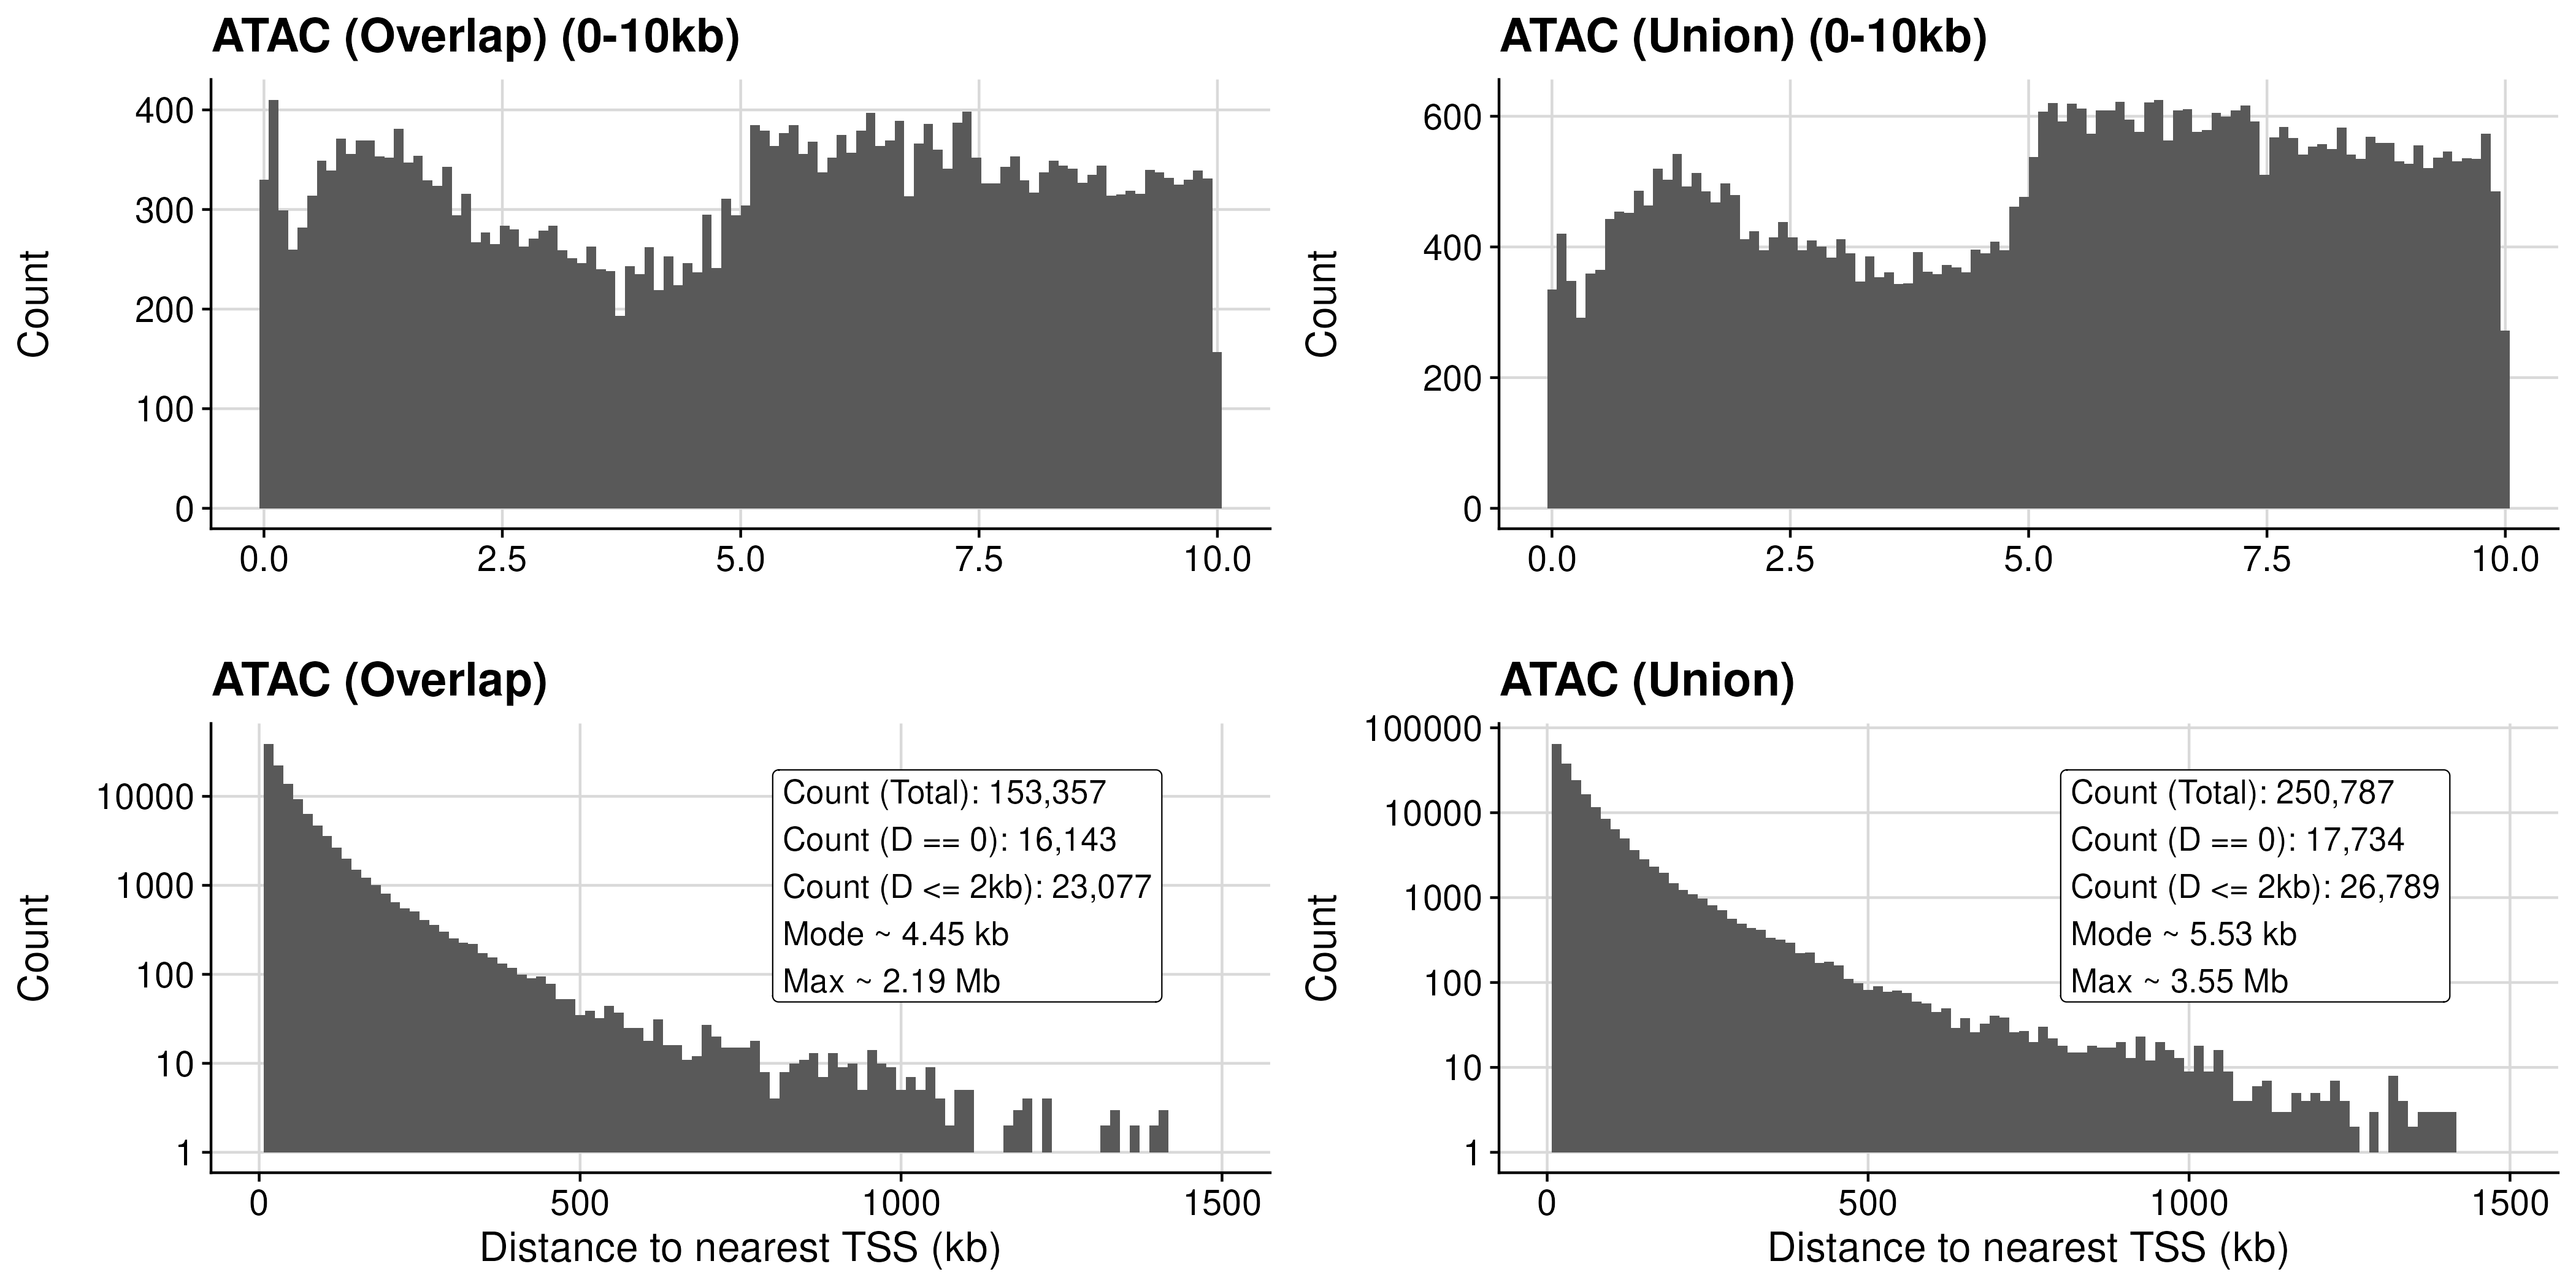
Distribution of TSS proximity
ENCODE K562 ATAC/DNase peaks
Distribution of length
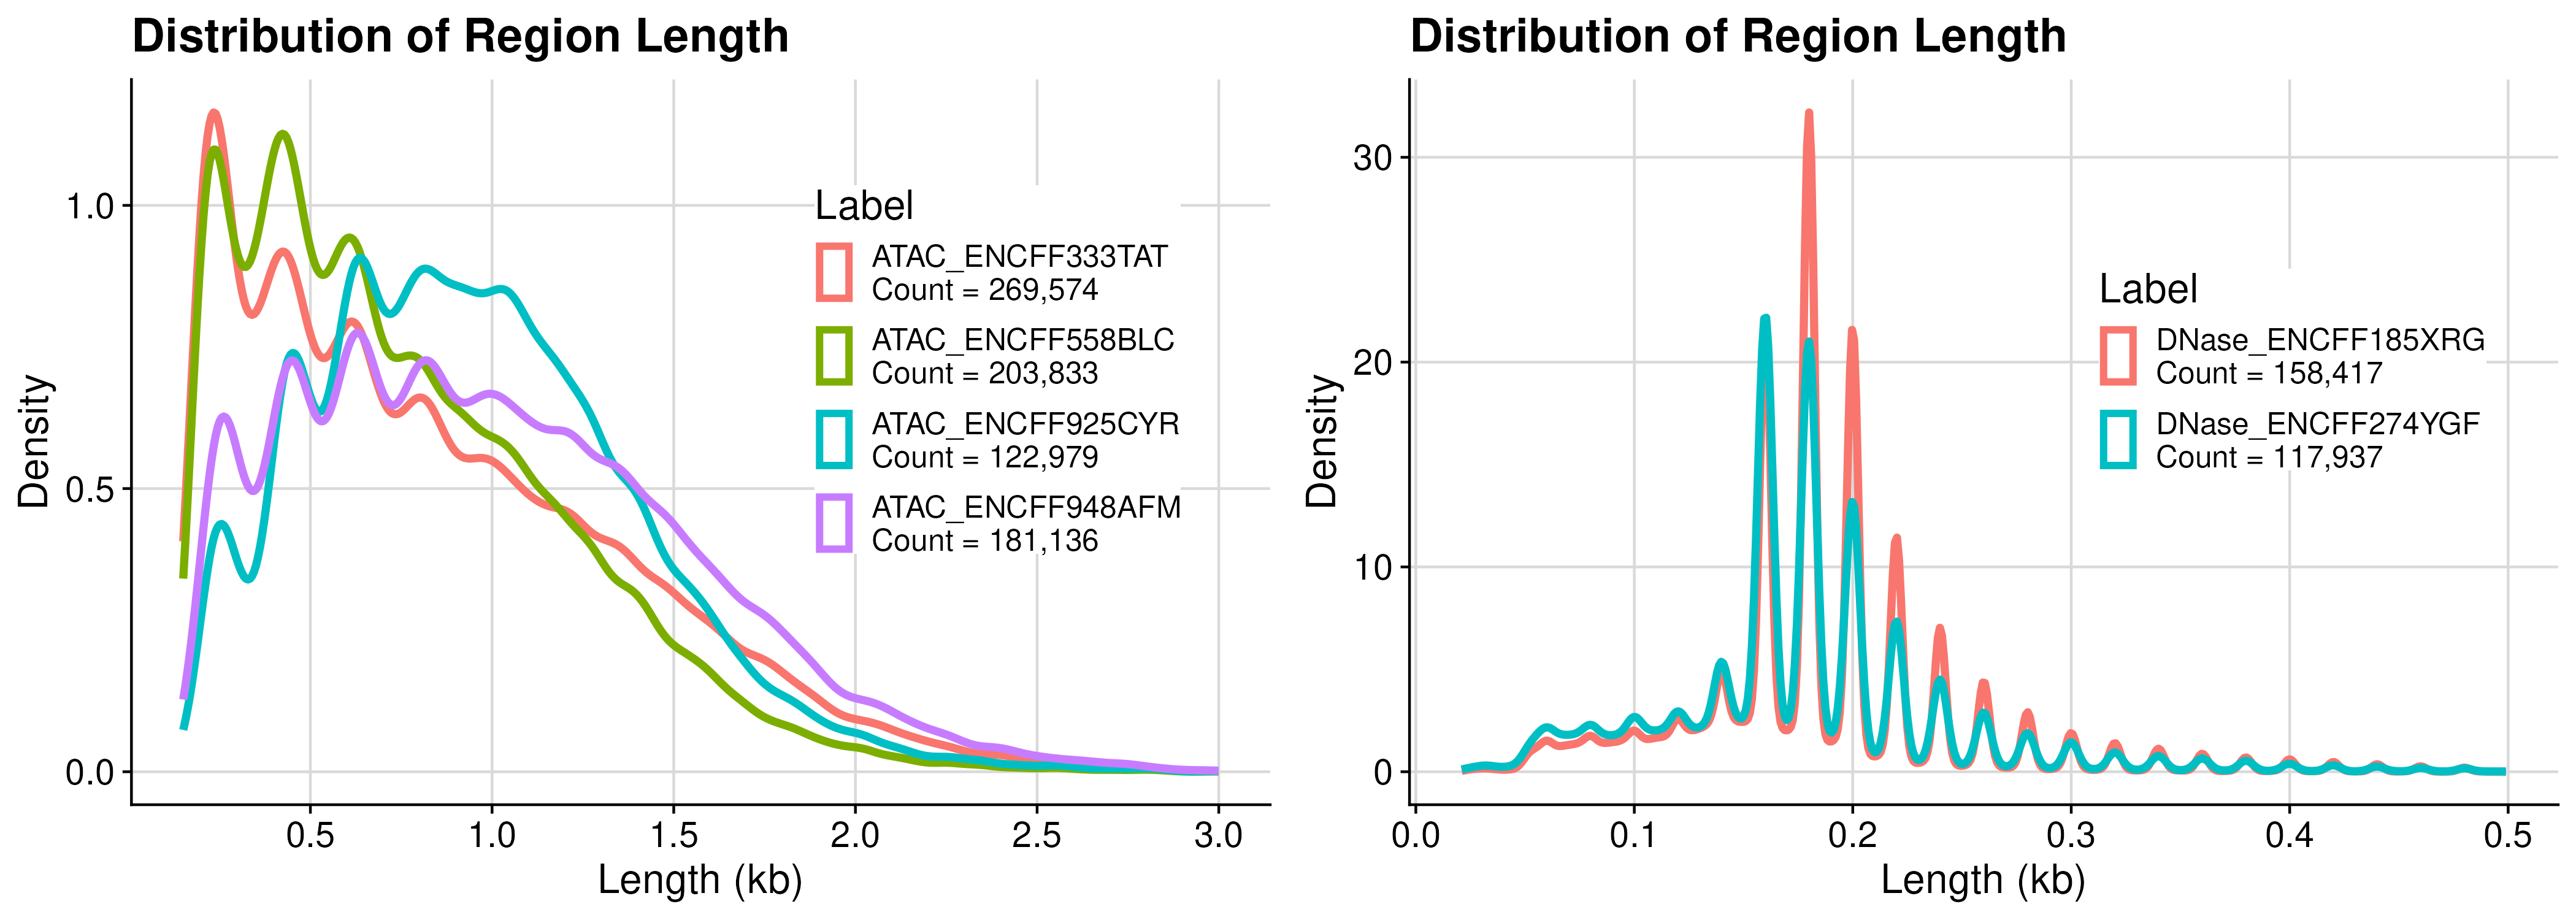
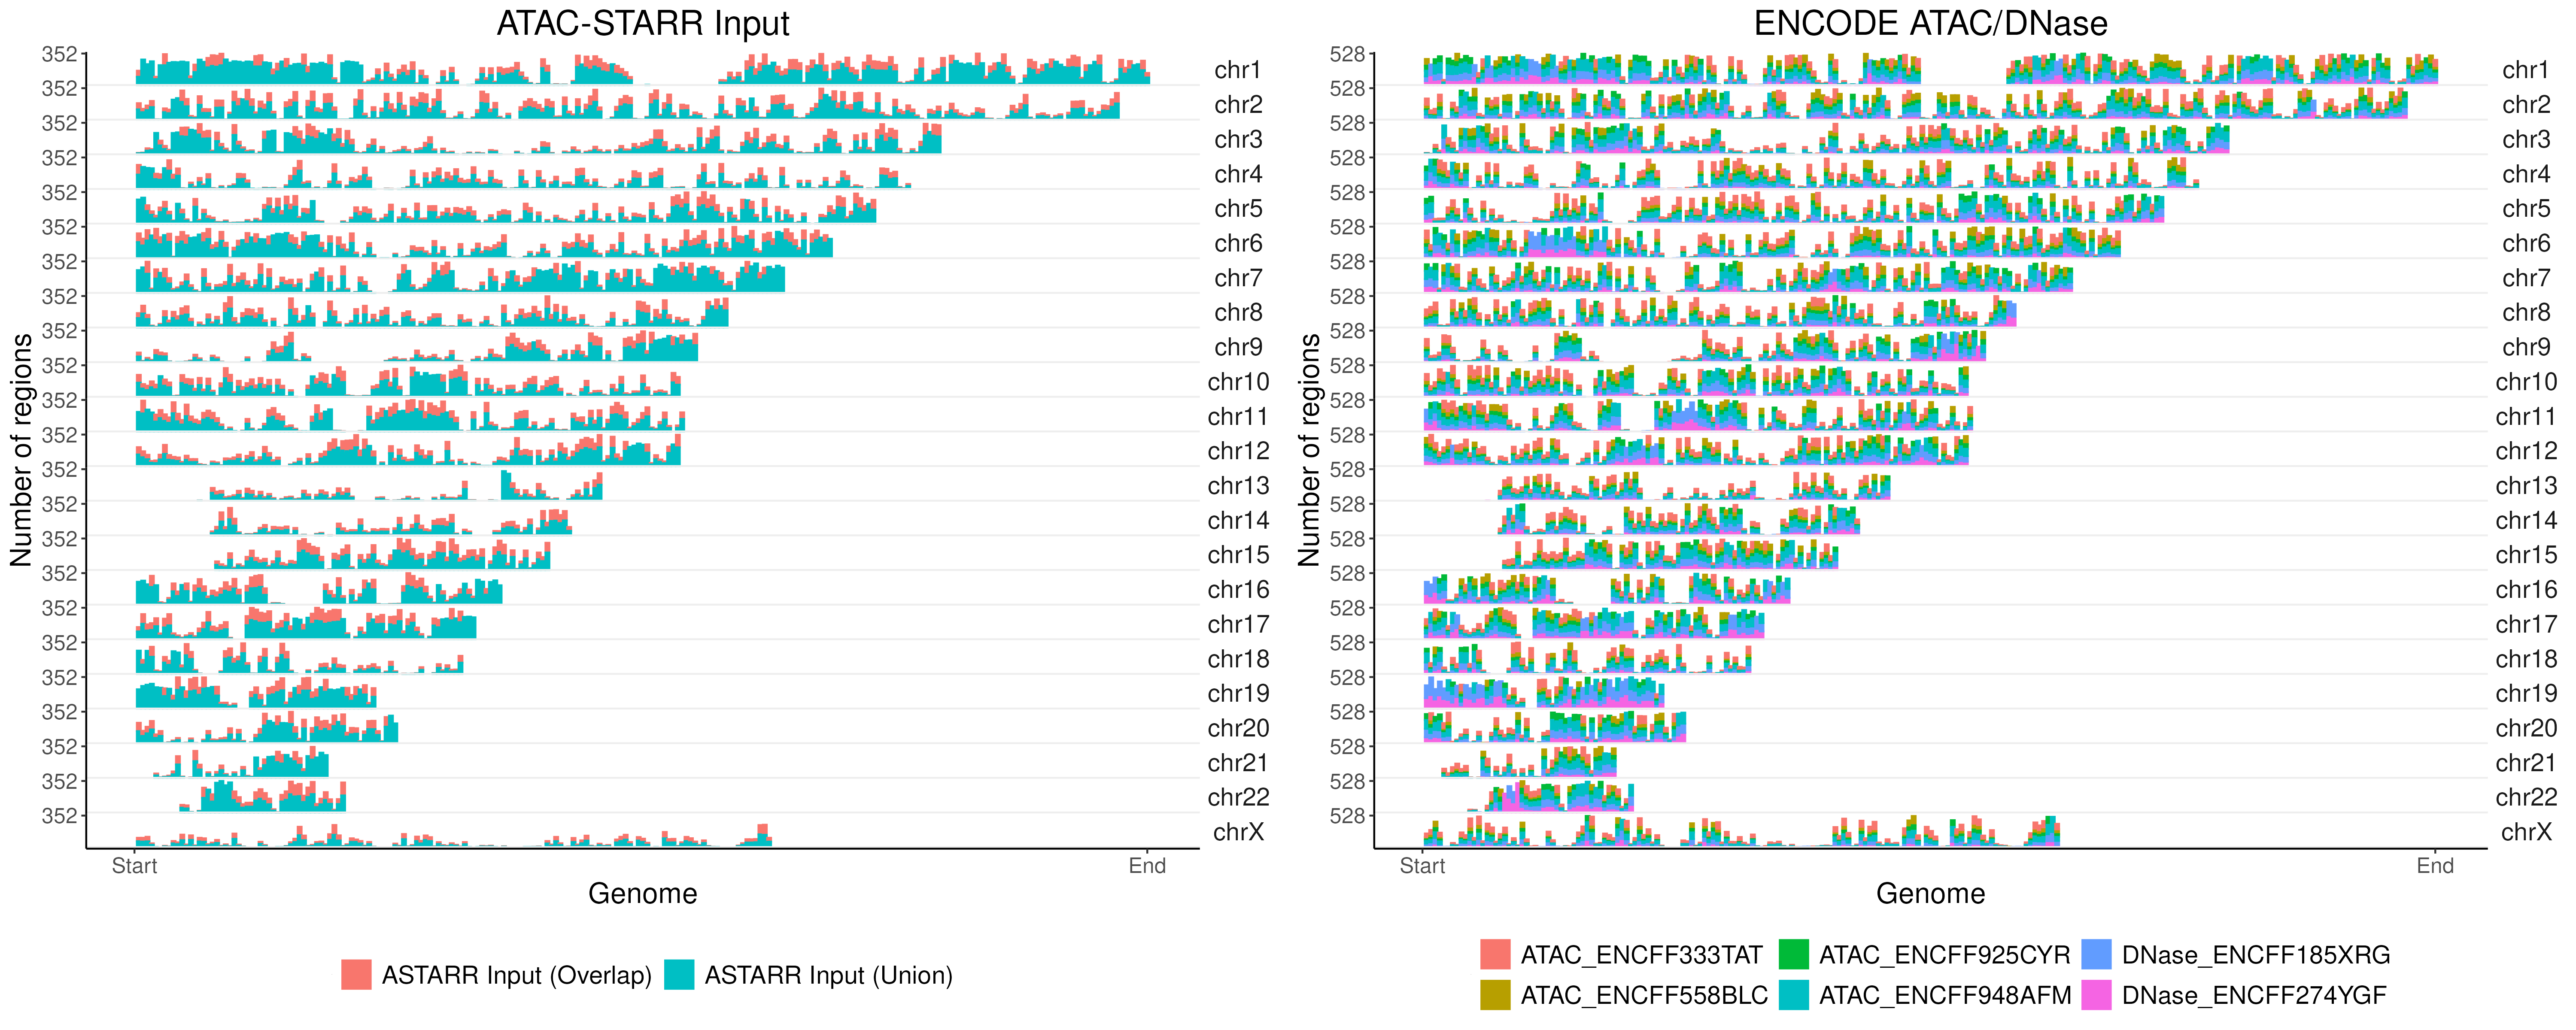
Comparison: Chromosome distribution plots of accessible regions
Size comparison
| Assay | Index_Experiment | Index_File | Method | Count_Row | Count_Region |
|---|---|---|---|---|---|
| ATAC-STARR-Input | ENCSR312UQM | . | Overlap peaks by bp across replicates | 150,042 | 150,042 |
| ATAC-STARR-Input | ENCSR312UQM | . | Union peaks by bp across replicates | 246,852 | 246,852 |
| DNase-seq | ENCSR000EKS | ENCFF274YGF | peaks | 118,721 | 118,721 |
| DNase-seq | ENCSR000EOT | ENCFF185XRG | peaks | 159,277 | 159,277 |
| ATAC-seq | ENCSR483RKN | ENCFF558BLC | pseudoreplicated peaks | 203,874 | 107,082 |
| ATAC-seq | ENCSR483RKN | ENCFF925CYR | IDR thresholded peaks | 123,009 | 51,861 |
| ATAC-seq | ENCSR868FGK | ENCFF333TAT | pseudoreplicated peaks | 269,800 | 161,693 |
| ATAC-seq | ENCSR868FGK | ENCFF948AFM | IDR thresholded peaks | 181,340 | 90,015 |