Full CREs from STARR/MPRA/CRISPR assays
here we do not consider the assay direction
- direciton of CRISPR for each location could undergo different mechanism to affect gene expression
- the downstream analysis, we are using unsupervised methods
After assay vote 2:
| Region | Count |
|---|---|
| ATAC (Overlap) | 33,953 |
| ATAC (Union) | 39,788 |
Below the report will focus on the ATAC (Overlap) (Number of regions = 33,953)
Count of those regions by assays
| Group | ATAC (Overlap) | ATAC (Union) |
|---|---|---|
| ASTARR | 32,021 | 37,777 |
| CRISPRi-Growth | 3,713 | 4,175 |
| CRISPRi-HCRFF | 49 | 51 |
| E2G-Benchmark | 330 | 338 |
| LMPRA | 18,043 | 19,091 |
| TMPRA | 655 | 796 |
| WSTARR | 25,331 | 30,357 |
Count of those regions by assay types
| Type | ATAC (Overlap) | ATAC (Union) |
|---|---|---|
| CRISPR | 4,036 | 4,507 |
| MPRA | 18,495 | 19,650 |
| STARR | 33,796 | 39,623 |
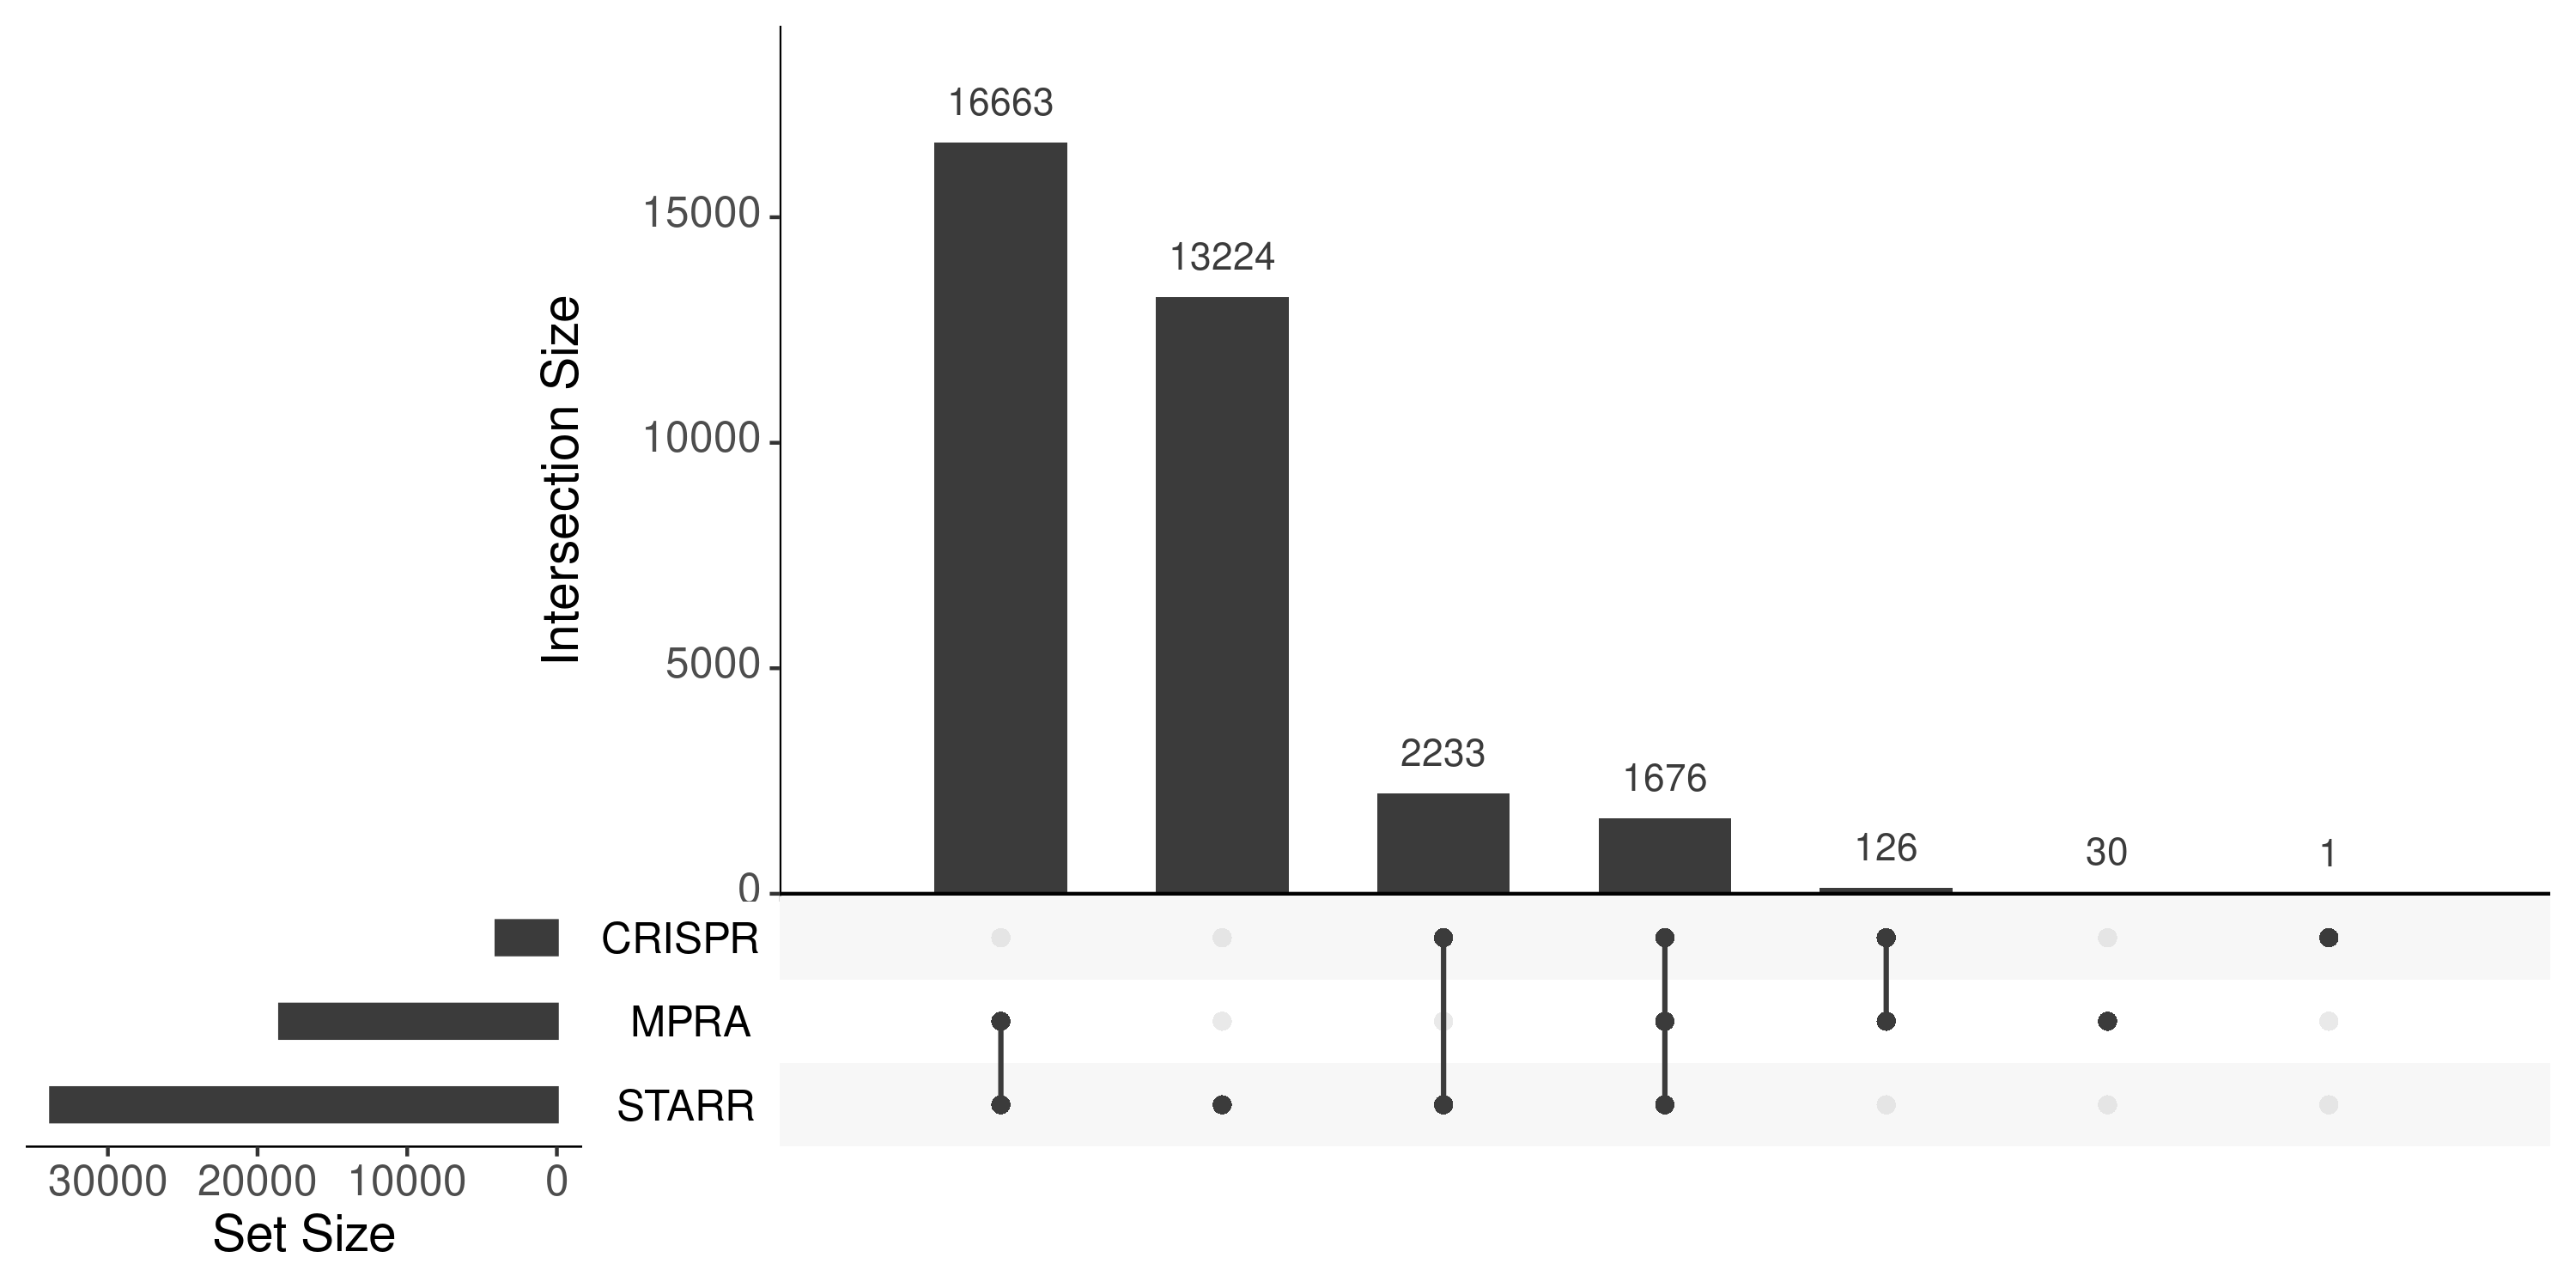
upset plots across STARR, MPRA, and CRISPR to show the overlapping
todo: after finishing region coverage of fcc -> screen and rate bar chart