Intersect/Summarize FCC peak calls by accessible regions
STARR/MPRA
After intersect all STARR/MPRA peak calls with ATAC regions, we could summarized ATAC reigon count table as follow:
| Group | Peak (Total) | ATAC (Overlap) | ATAC (Union) |
|---|---|---|---|
| ASTARR | 229,239 | 90,765 | 121,822 |
| LMPRA | 26,192 | 20,905 | 22,274 |
| TMPRA | 6,329 | 848 | 1,106 |
| WSTARR | 165,627 | 29,329 | 38,048 |
There are 99,749/135,016 ATAC regions intersected with at least one STARR/MPRA peak.
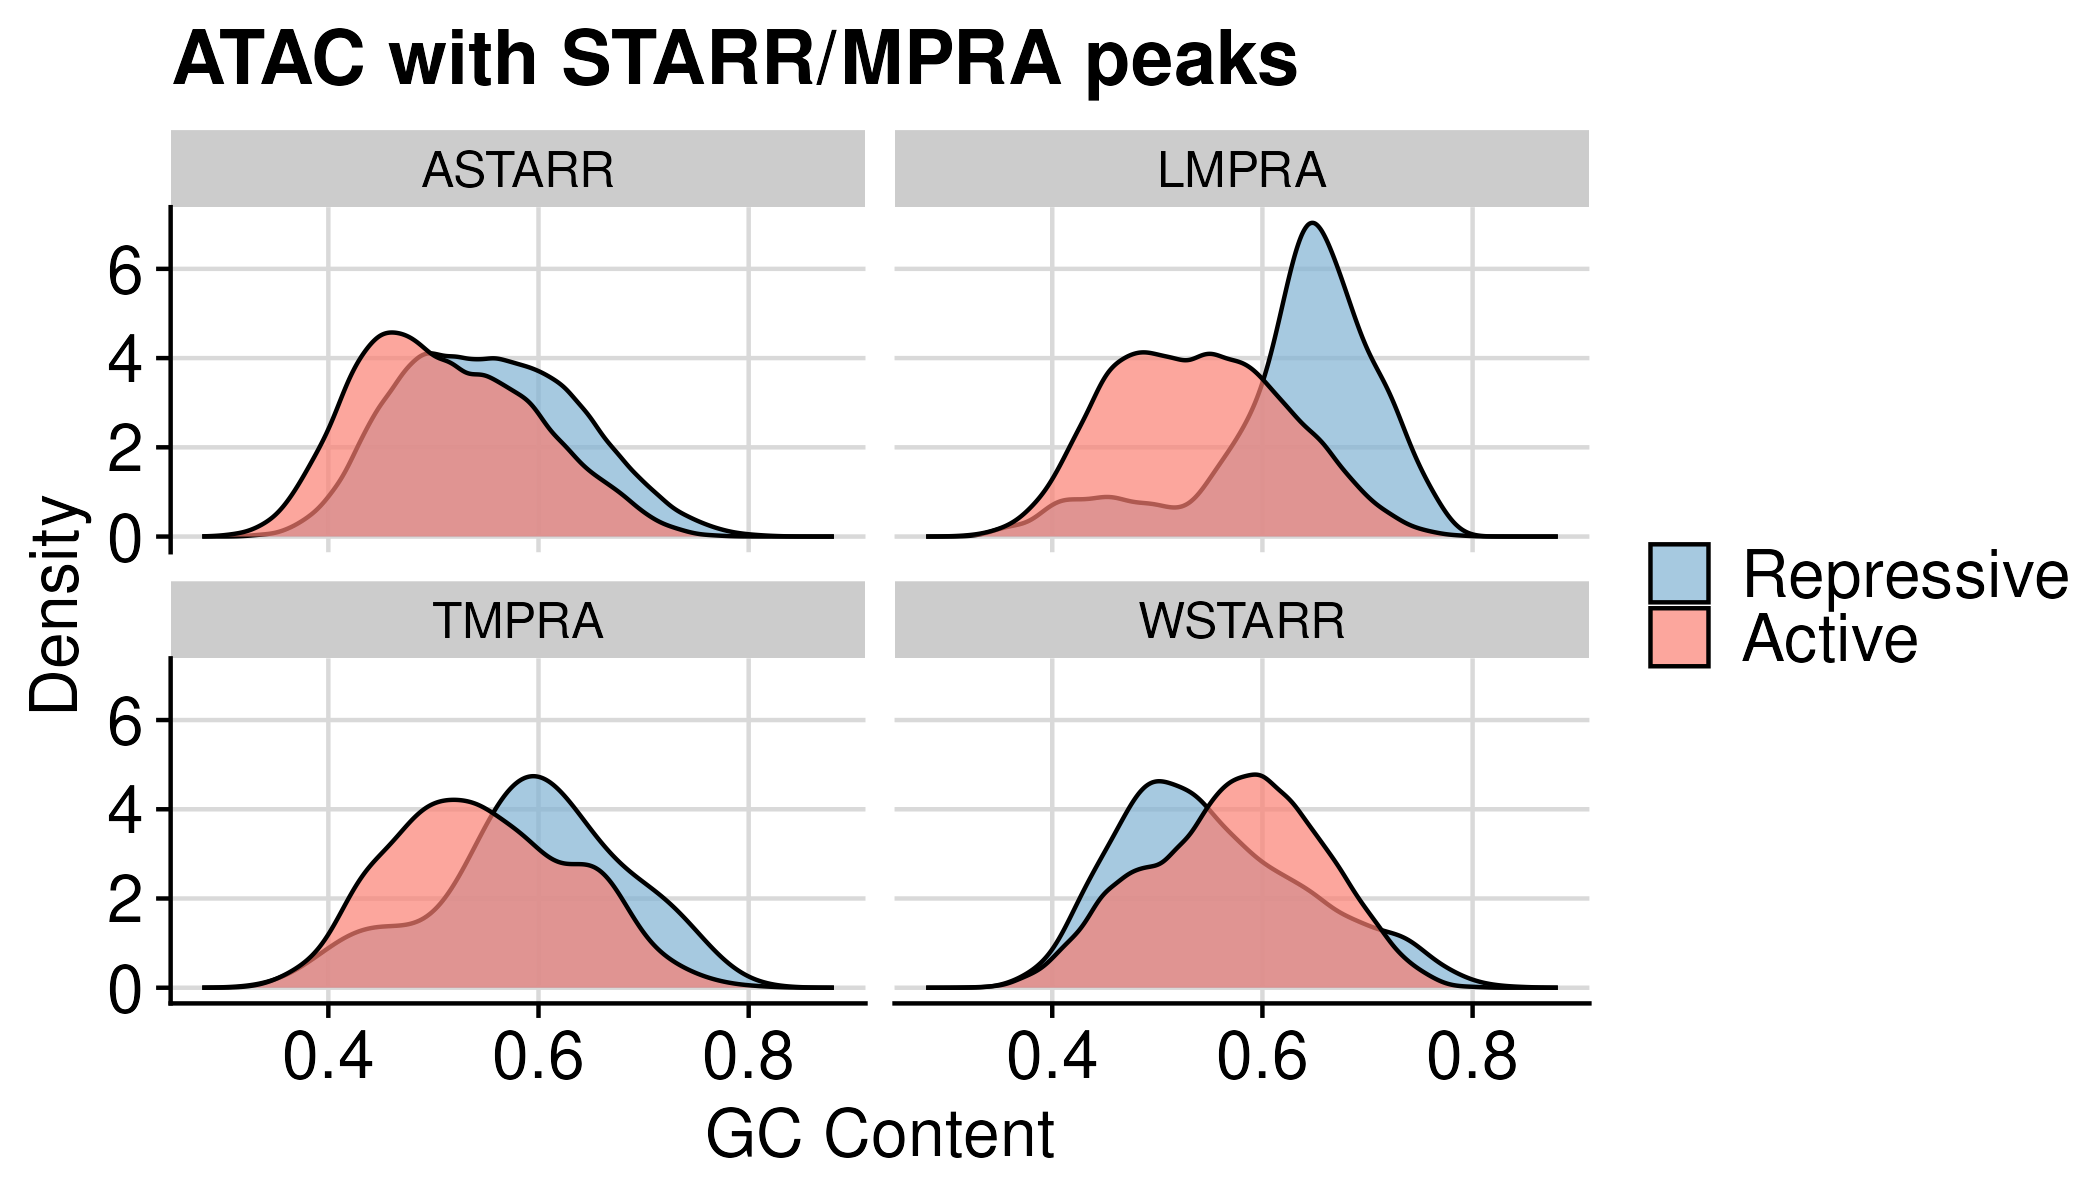
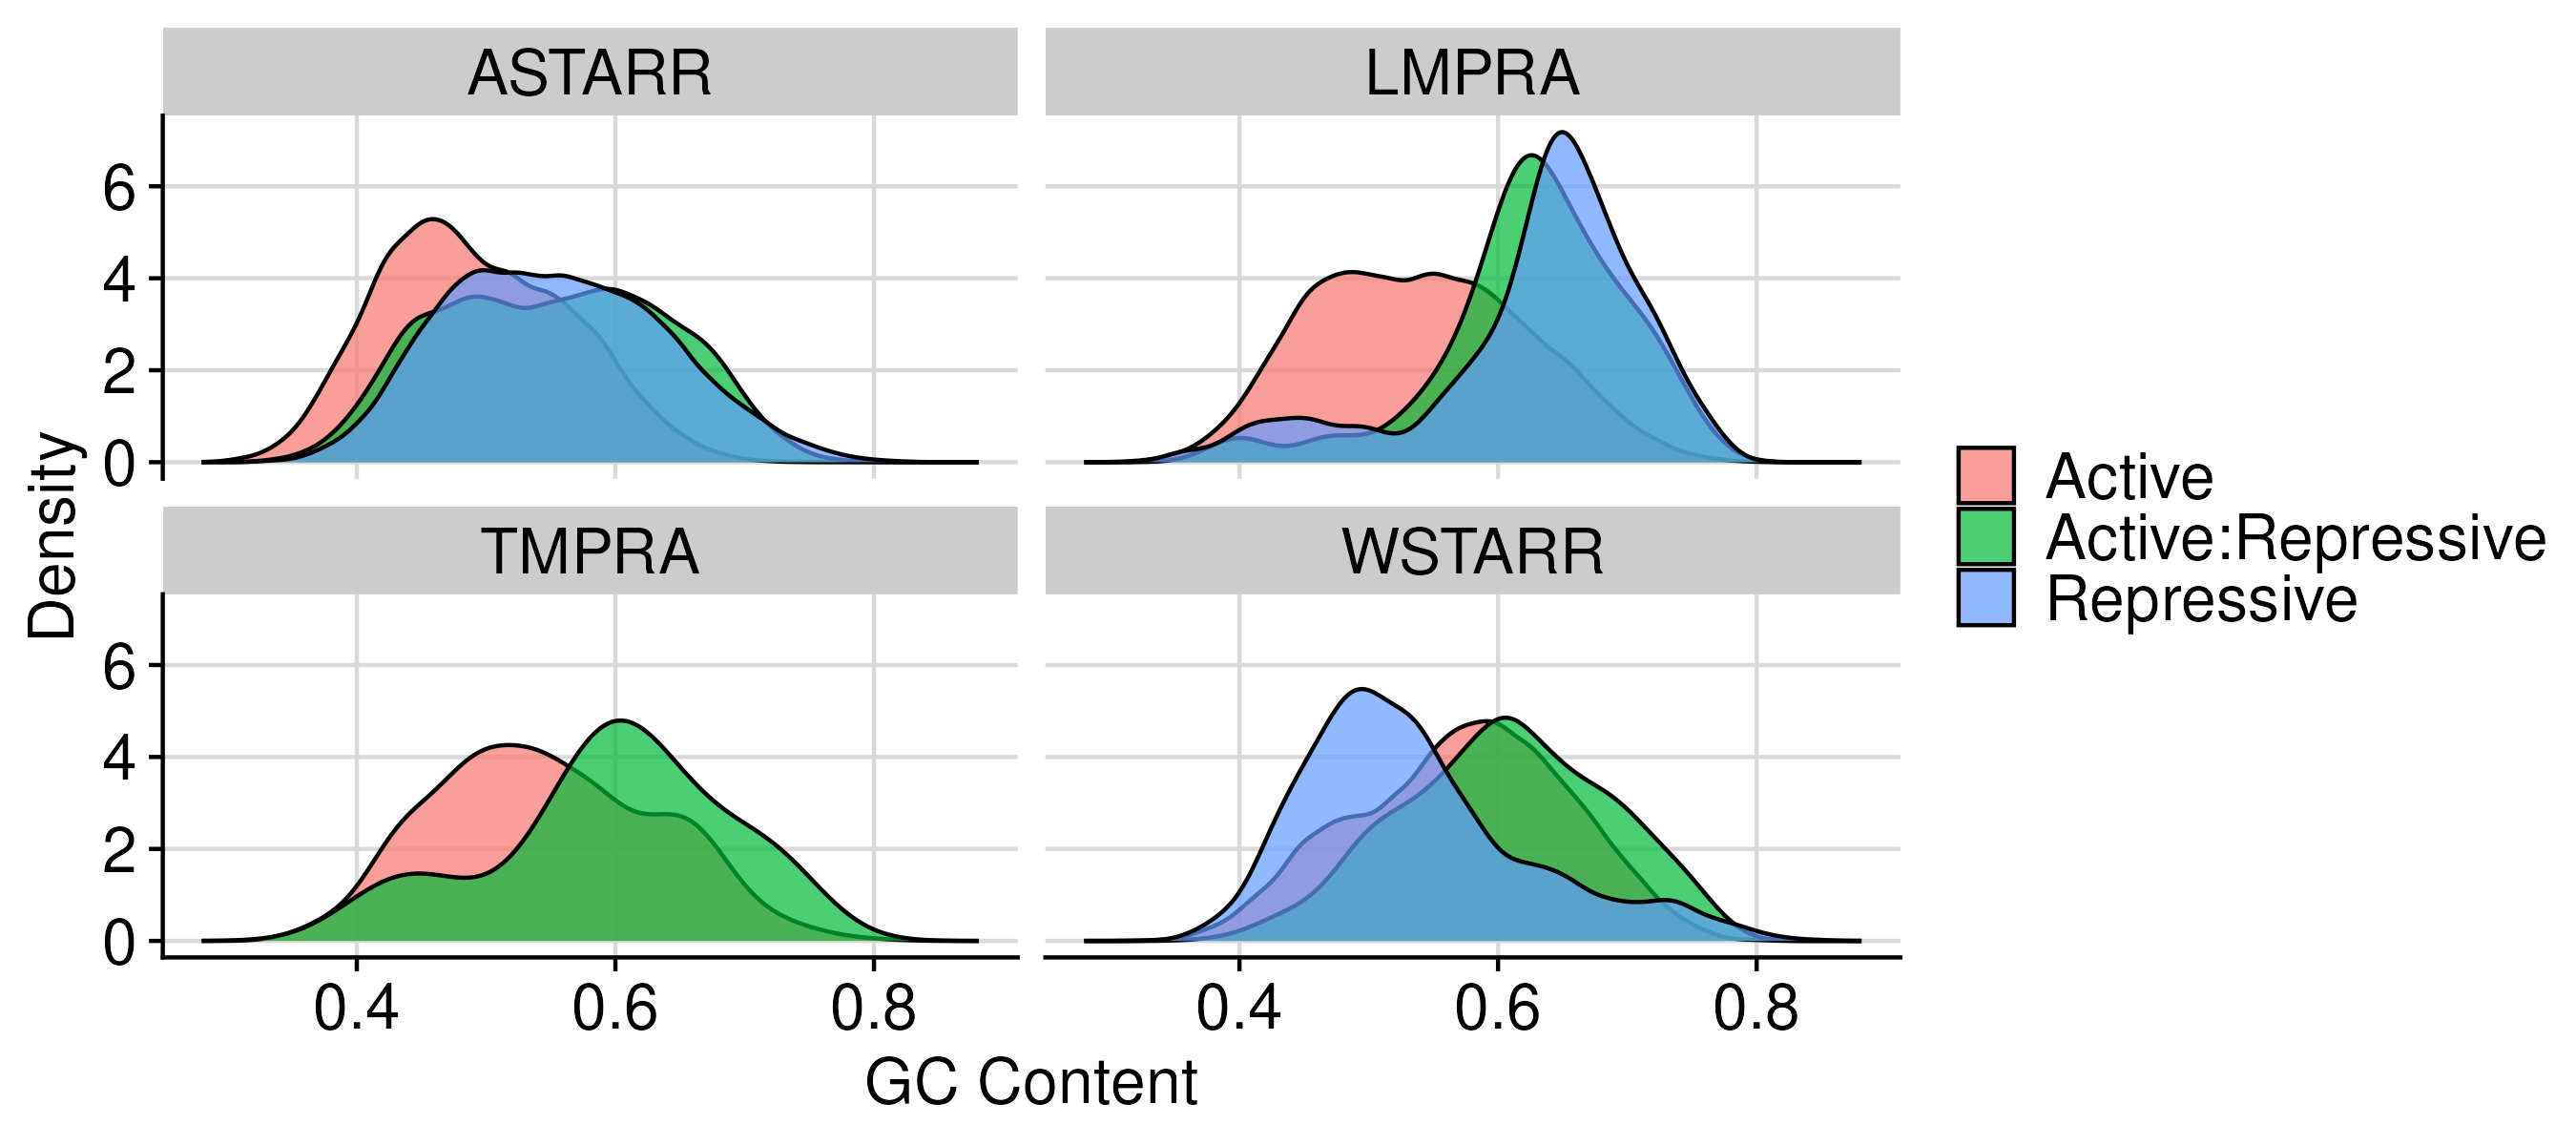
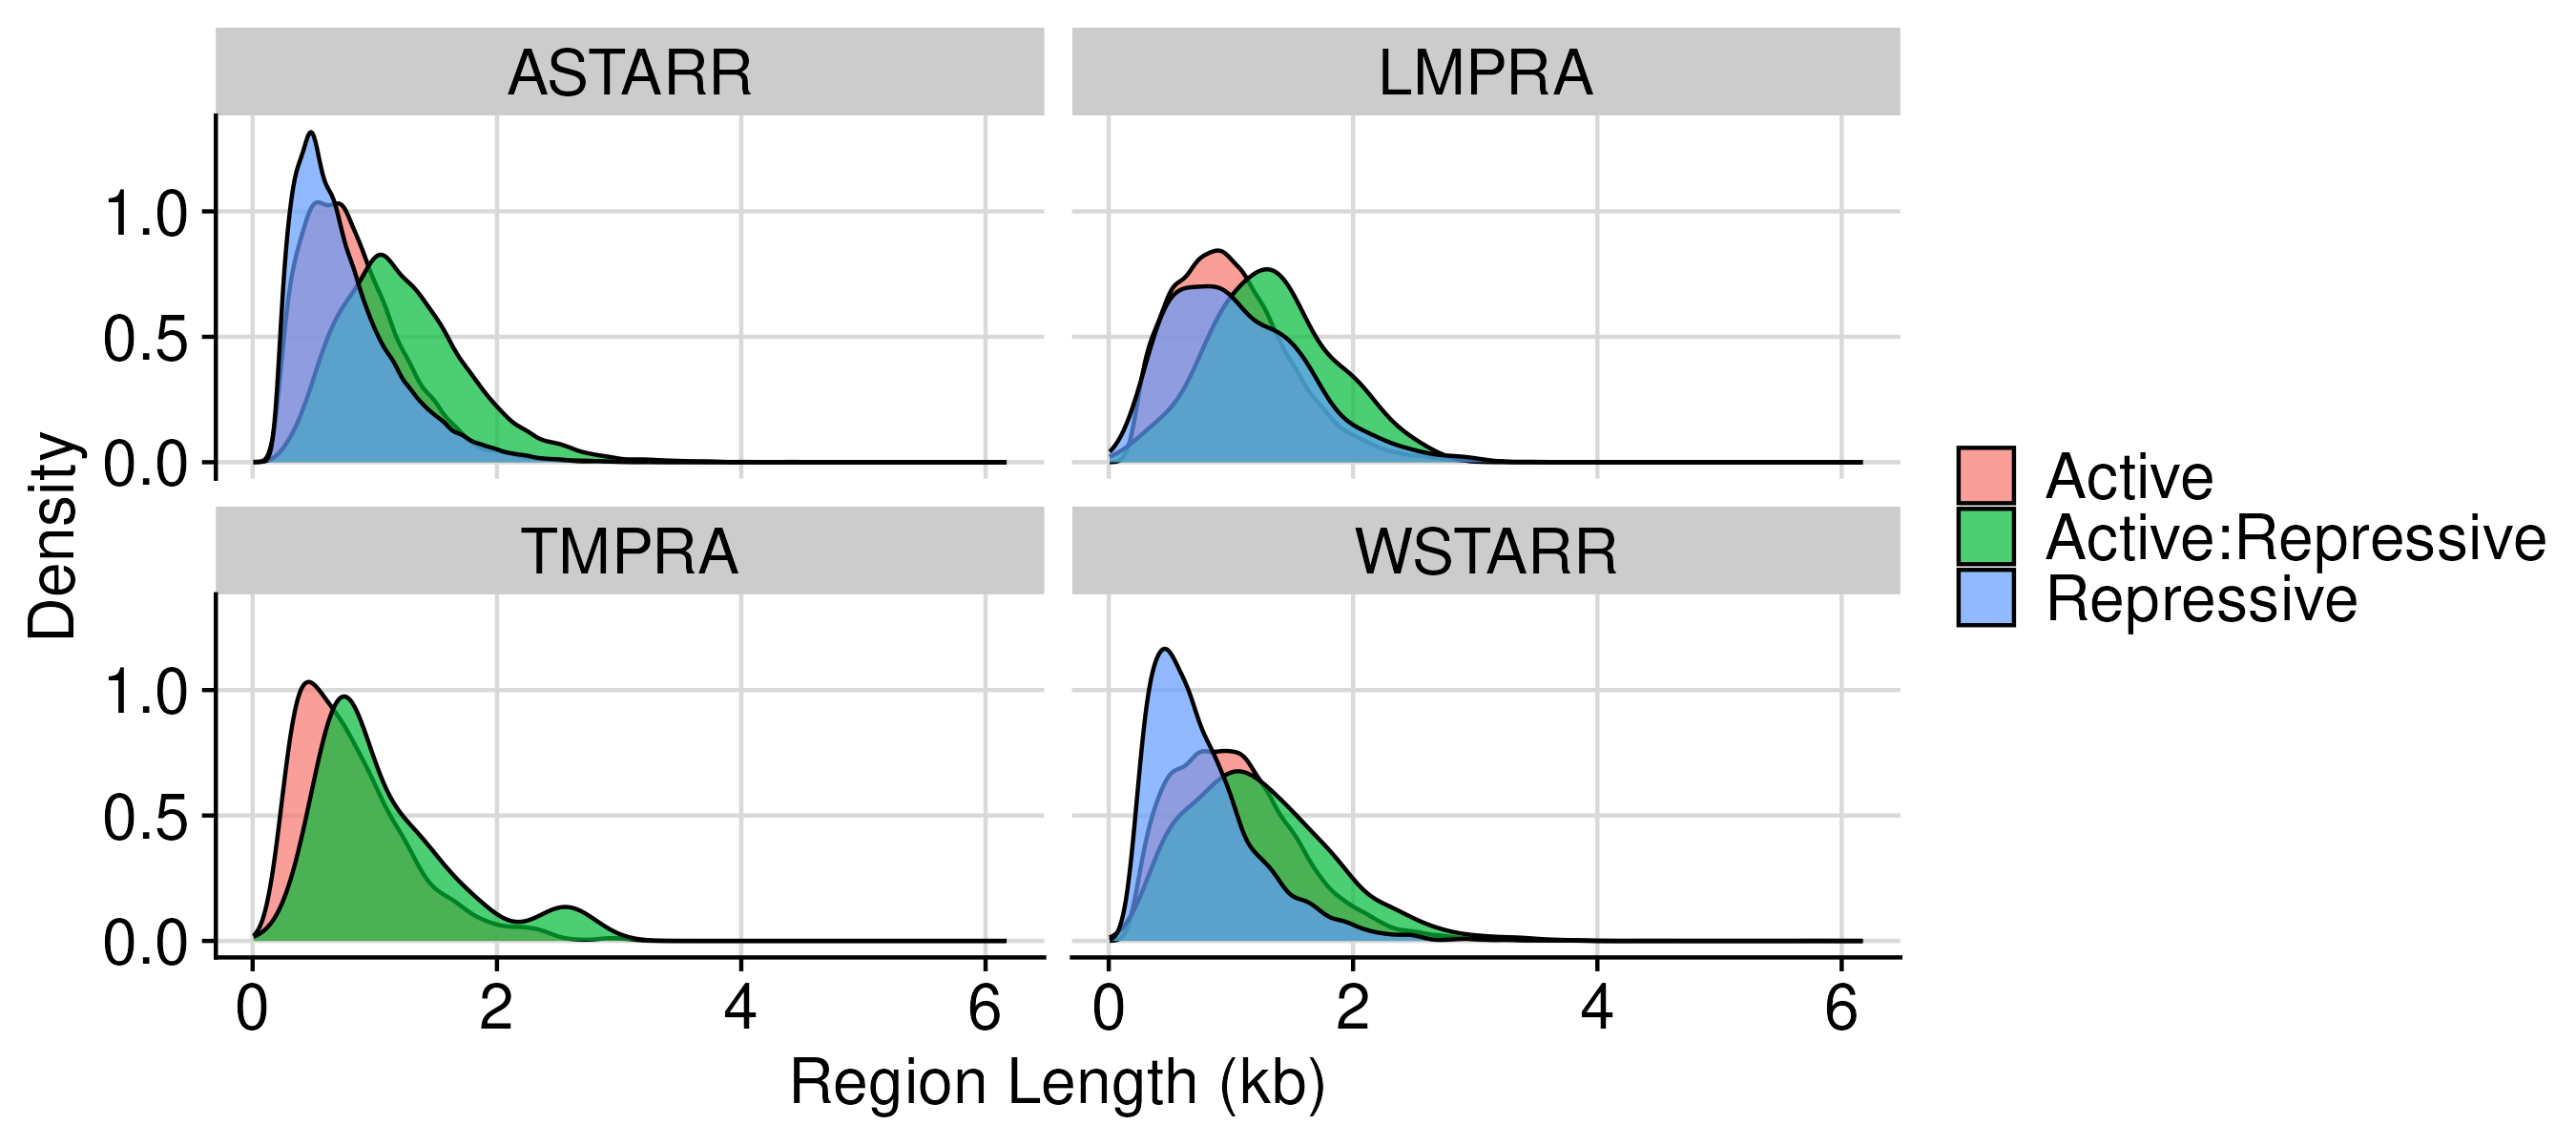
Distribution of GC content and region length at ATAC region; splitted by active and repressive peaks for each reporter assay
Summarize by direction:
Some regions may contain only active
| Region | Group | Active | Active:Repressive | Repressive |
|---|---|---|---|---|
| fcc_astarr_macs_input_overlap | ASTARR | 17,042 | 9,119 | 64,604 |
| fcc_astarr_macs_input_overlap | LMPRA | 20,660 | 32 | 213 |
| fcc_astarr_macs_input_overlap | TMPRA | 835 | 12 | 1 |
| fcc_astarr_macs_input_overlap | WSTARR | 26,140 | 852 | 2,337 |
| fcc_astarr_macs_input_union | ASTARR | 18,245 | 11,381 | 92,196 |
| fcc_astarr_macs_input_union | LMPRA | 21,985 | 37 | 252 |
| fcc_astarr_macs_input_union | TMPRA | 1,082 | 21 | 3 |
| fcc_astarr_macs_input_union | WSTARR | 31,974 | 1,376 | 4,698 |
CRISPRi-HCR FlowFISH
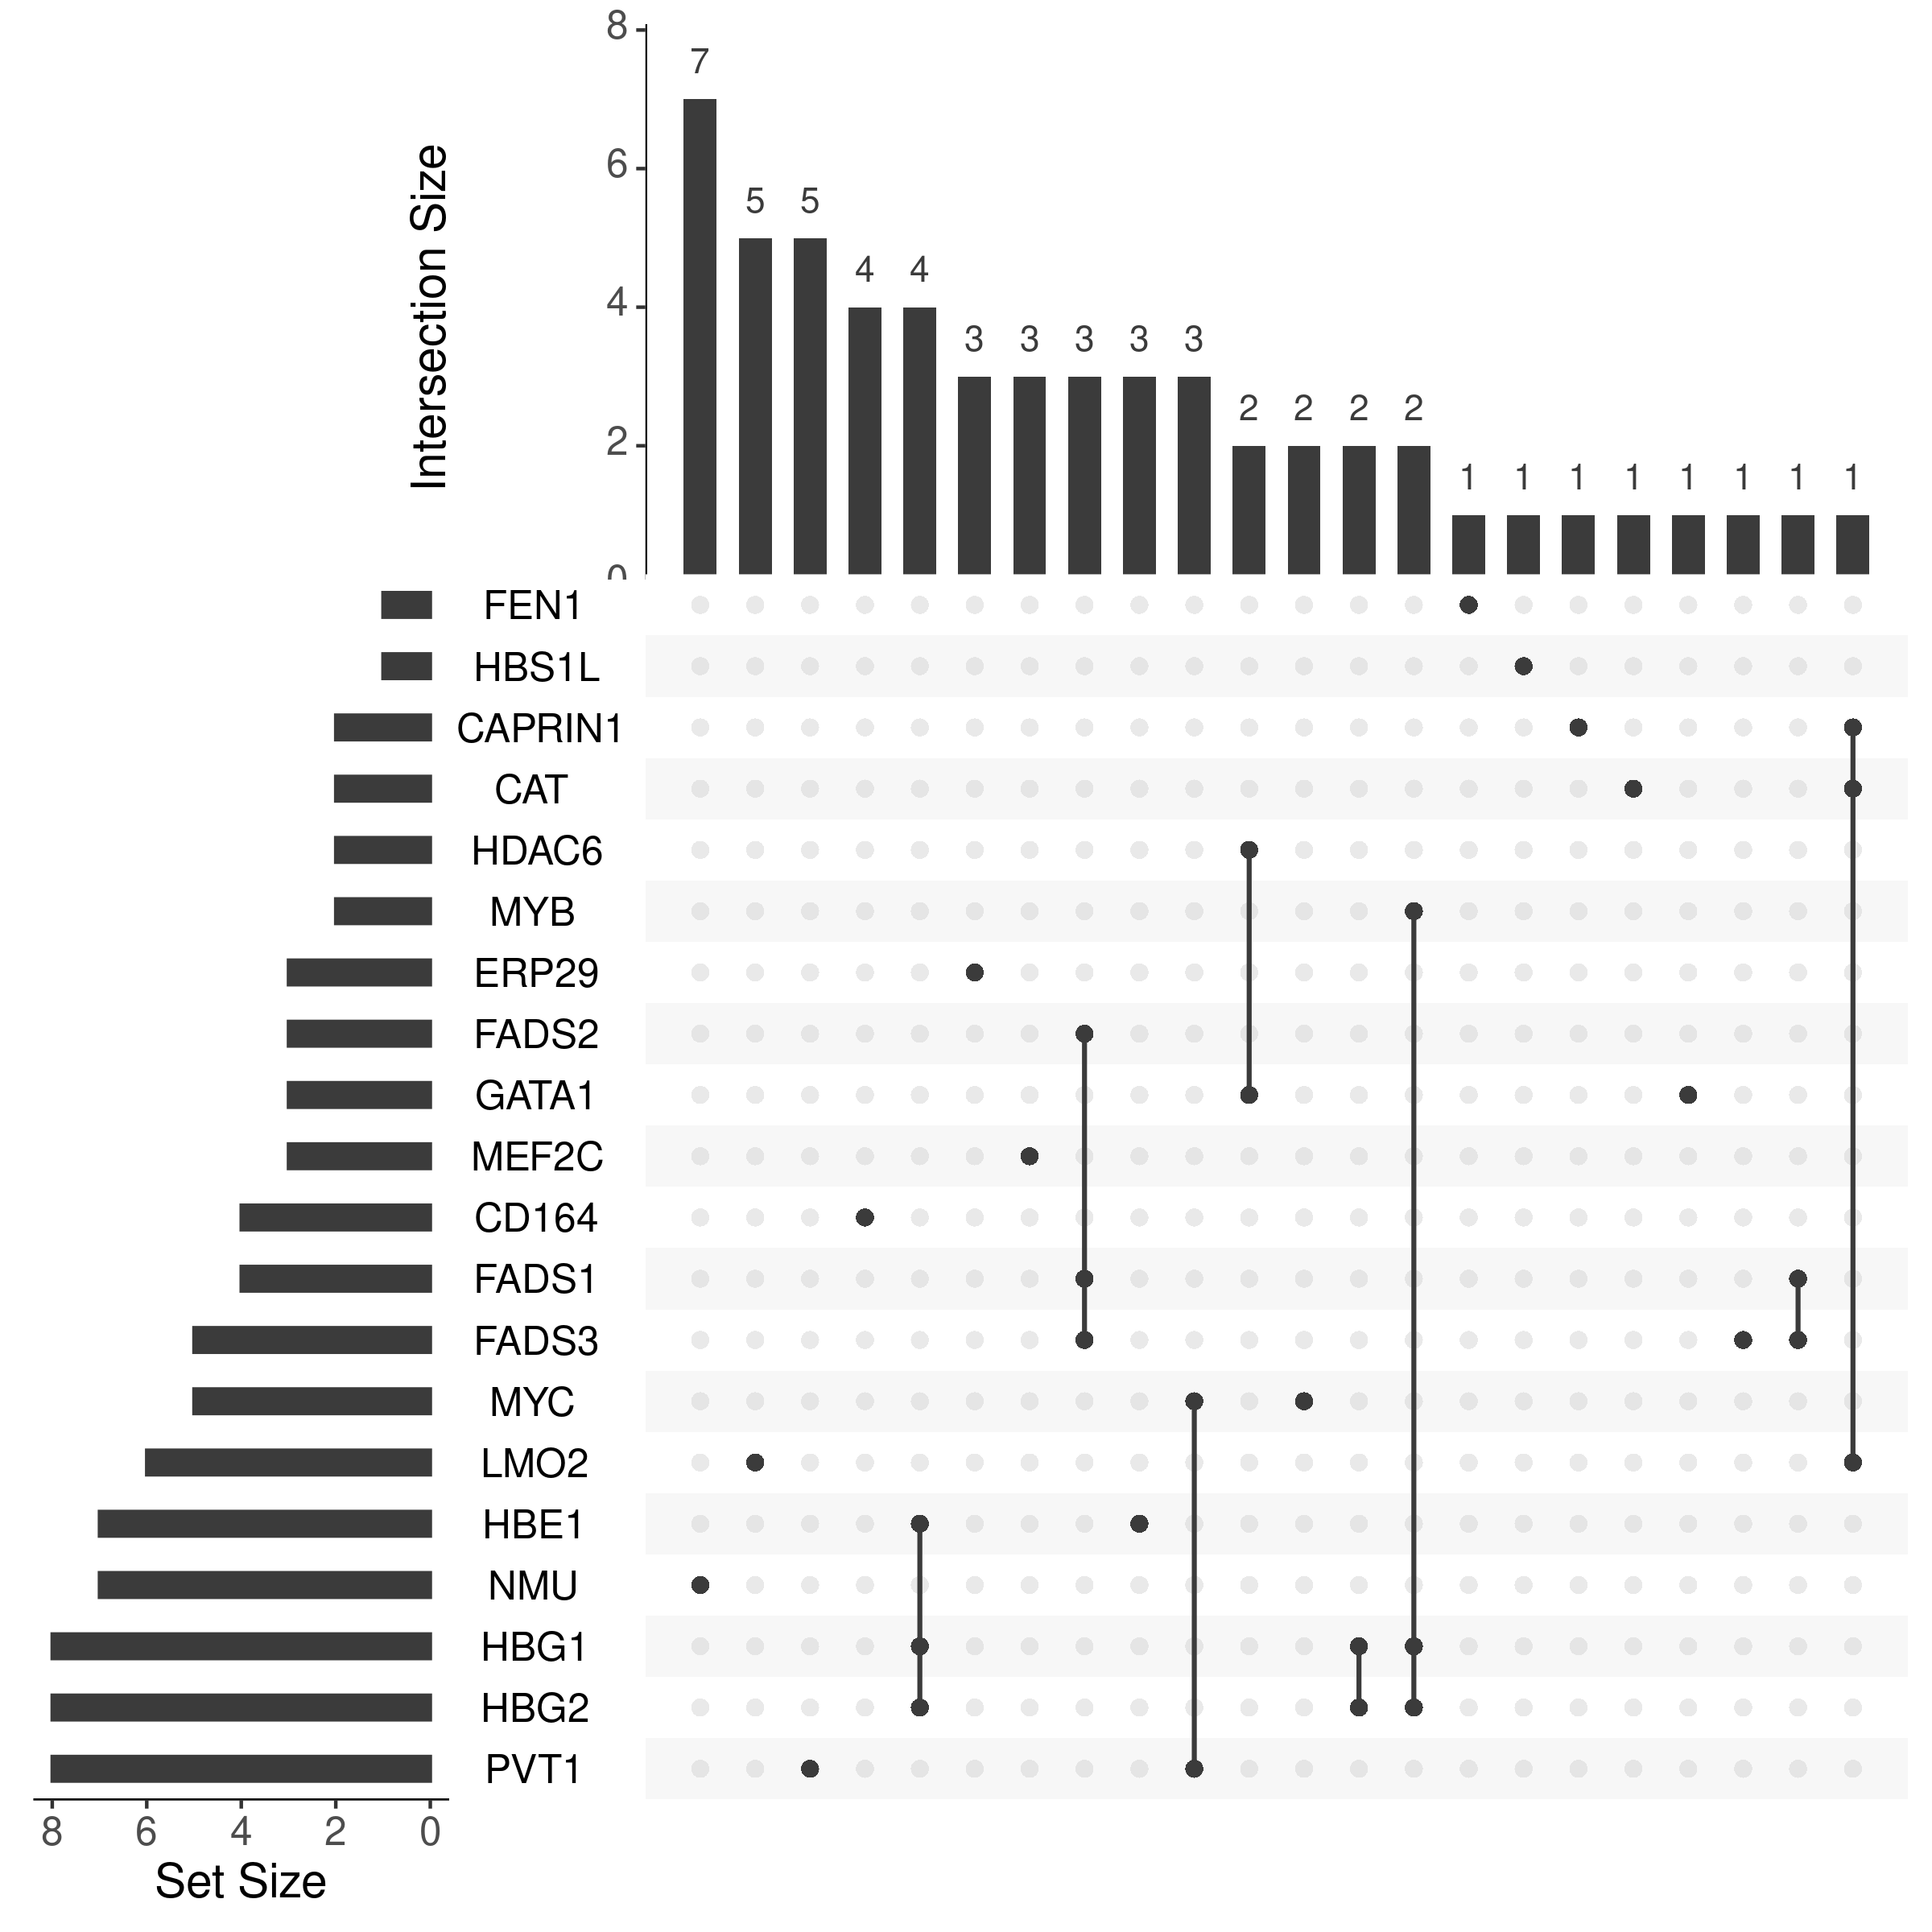
Total number of CASA peaks across 20 genes
There are 102 CASA peaks across 20 genes. After summarized using ATAC regions, about 80 ATAC regions contain at least one CASA peak.
| Group | Peak (Total) | ATAC (Overlap) | ATAC (Union) |
|---|---|---|---|
| CRISPRi-HCRFF | 102 | 84 | 86 |
Some regions regulate multiple genes. For example,
- GATA1/HDAC6
- FADS1/2 enhancer and FADS3
- LMO2/CAT
- MYC/PVT1
CRISPRi-Growth
Total DHS contains significant guides: 6,242
| Group | Peak (Total) | ATAC (Overlap) | ATAC (Union) |
|---|---|---|---|
| CRISPRi-Growth | 6,242 | 4,380 | 4,907 |
The results showed that 4k ATAC regions containing at least one significant guides.
A few regions contains more than one since ATAC peaks tends to have longer length than DHS peaks.
ENCODE E2G Benchmark
Number of links
| Group | Link (Total) | ATAC (Overlap) | ATAC (Union) |
|---|---|---|---|
| E2G-Benchmark | 472 | 422 | 424 |
Number of regions
| Group | Peak (Total) | ATAC (Overlap) | ATAC (Union) |
|---|---|---|---|
| E2G-Benchmark | 420 | 360 | 362 |
Using the ATAC region, we could summarise the regions that regulate multiple genes.
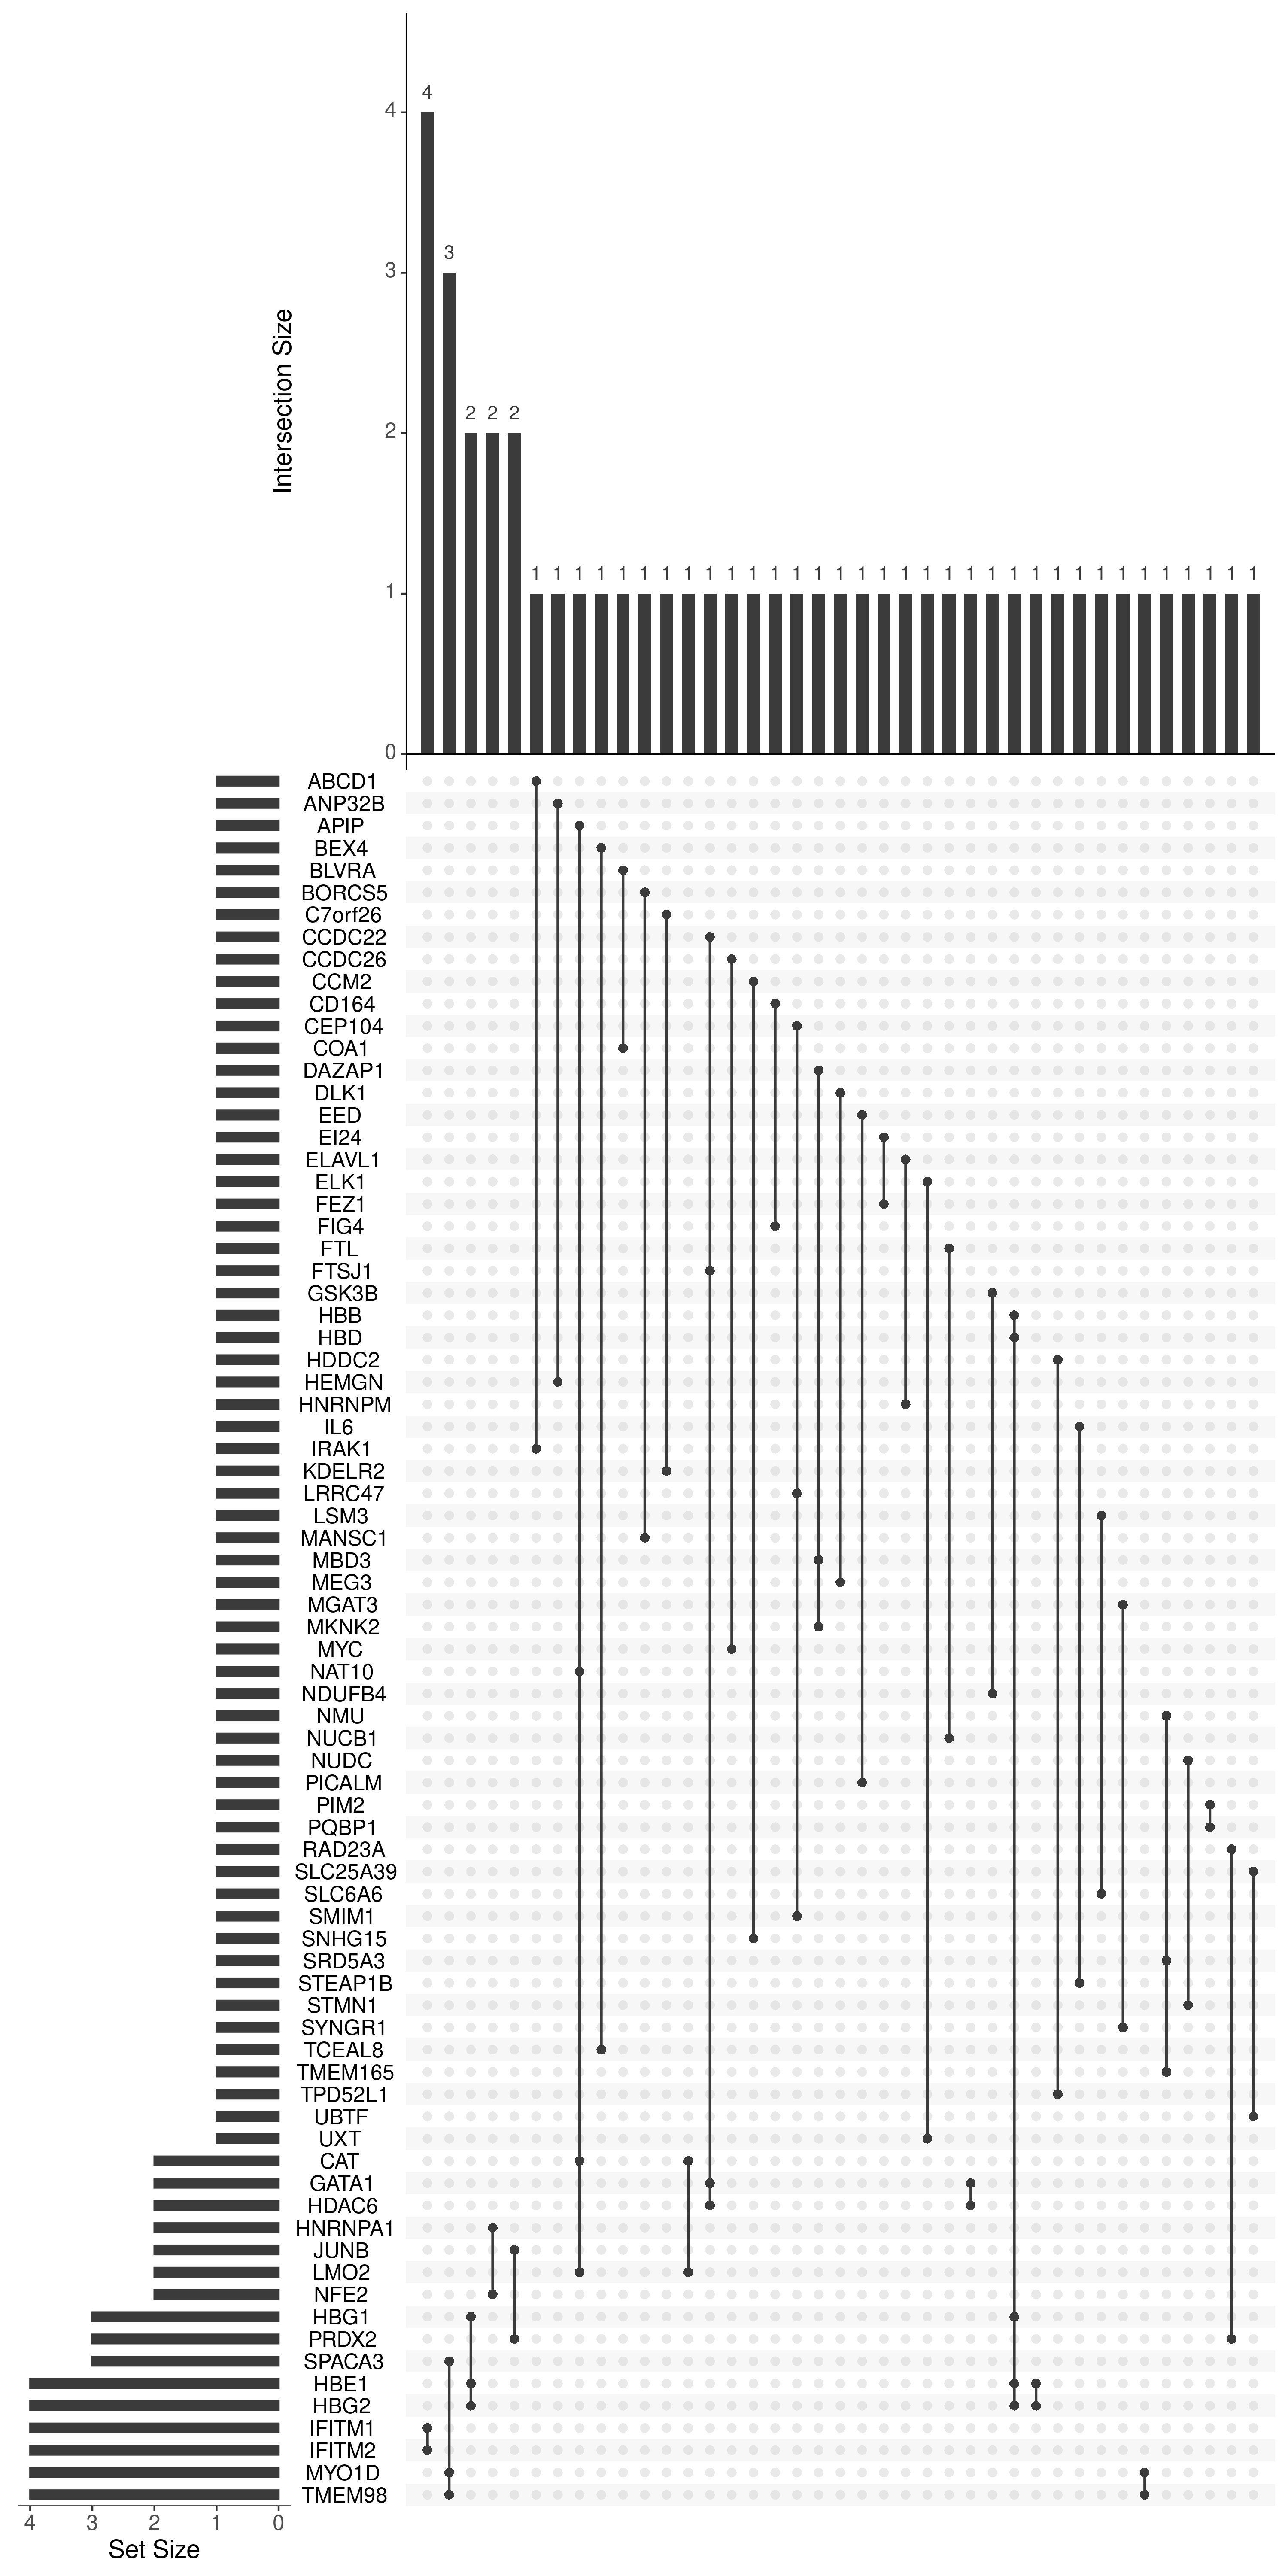
Pairs that are also captured in CRISPRi-HCR FlowFISH
- GATA1/HDAC6
- HBE1/HBG1/HBG2
- LMO2/CAT
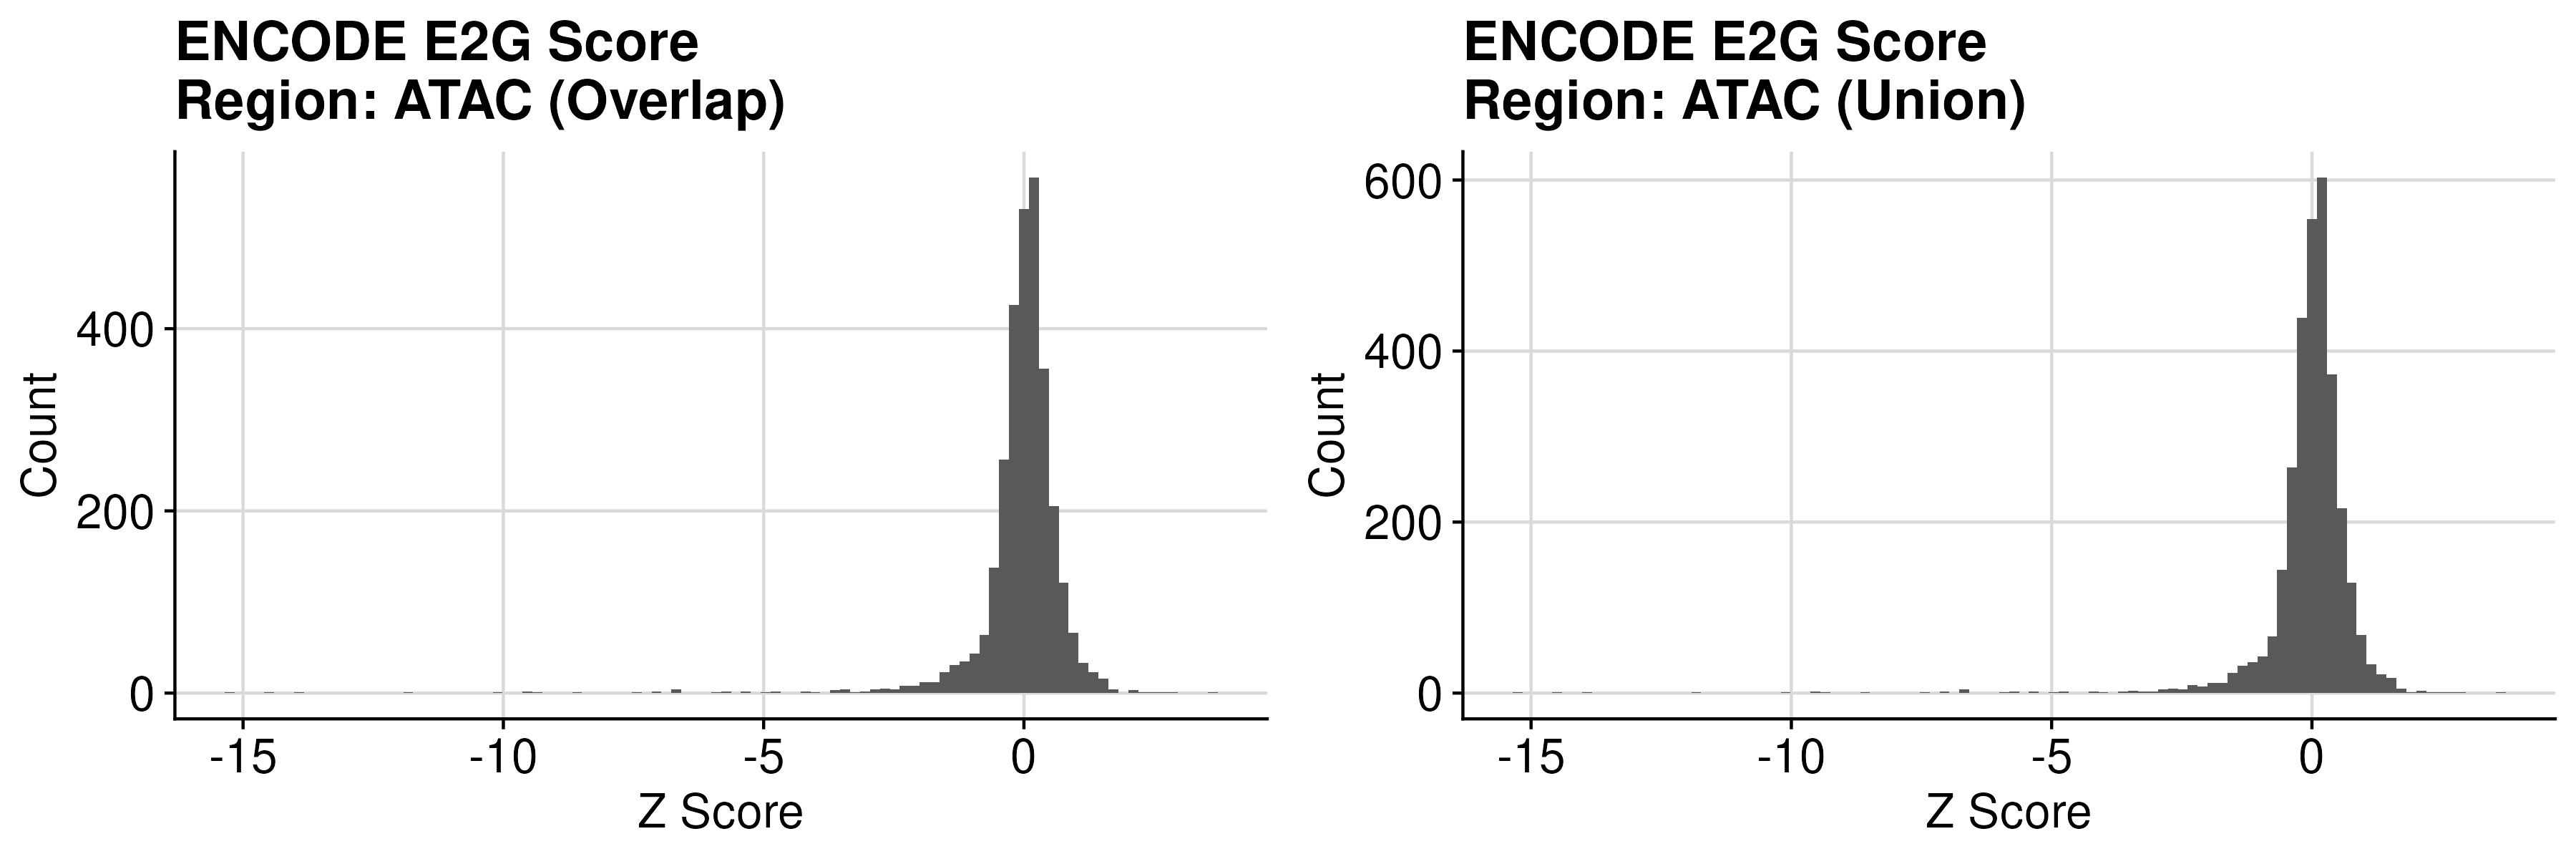
score distribution