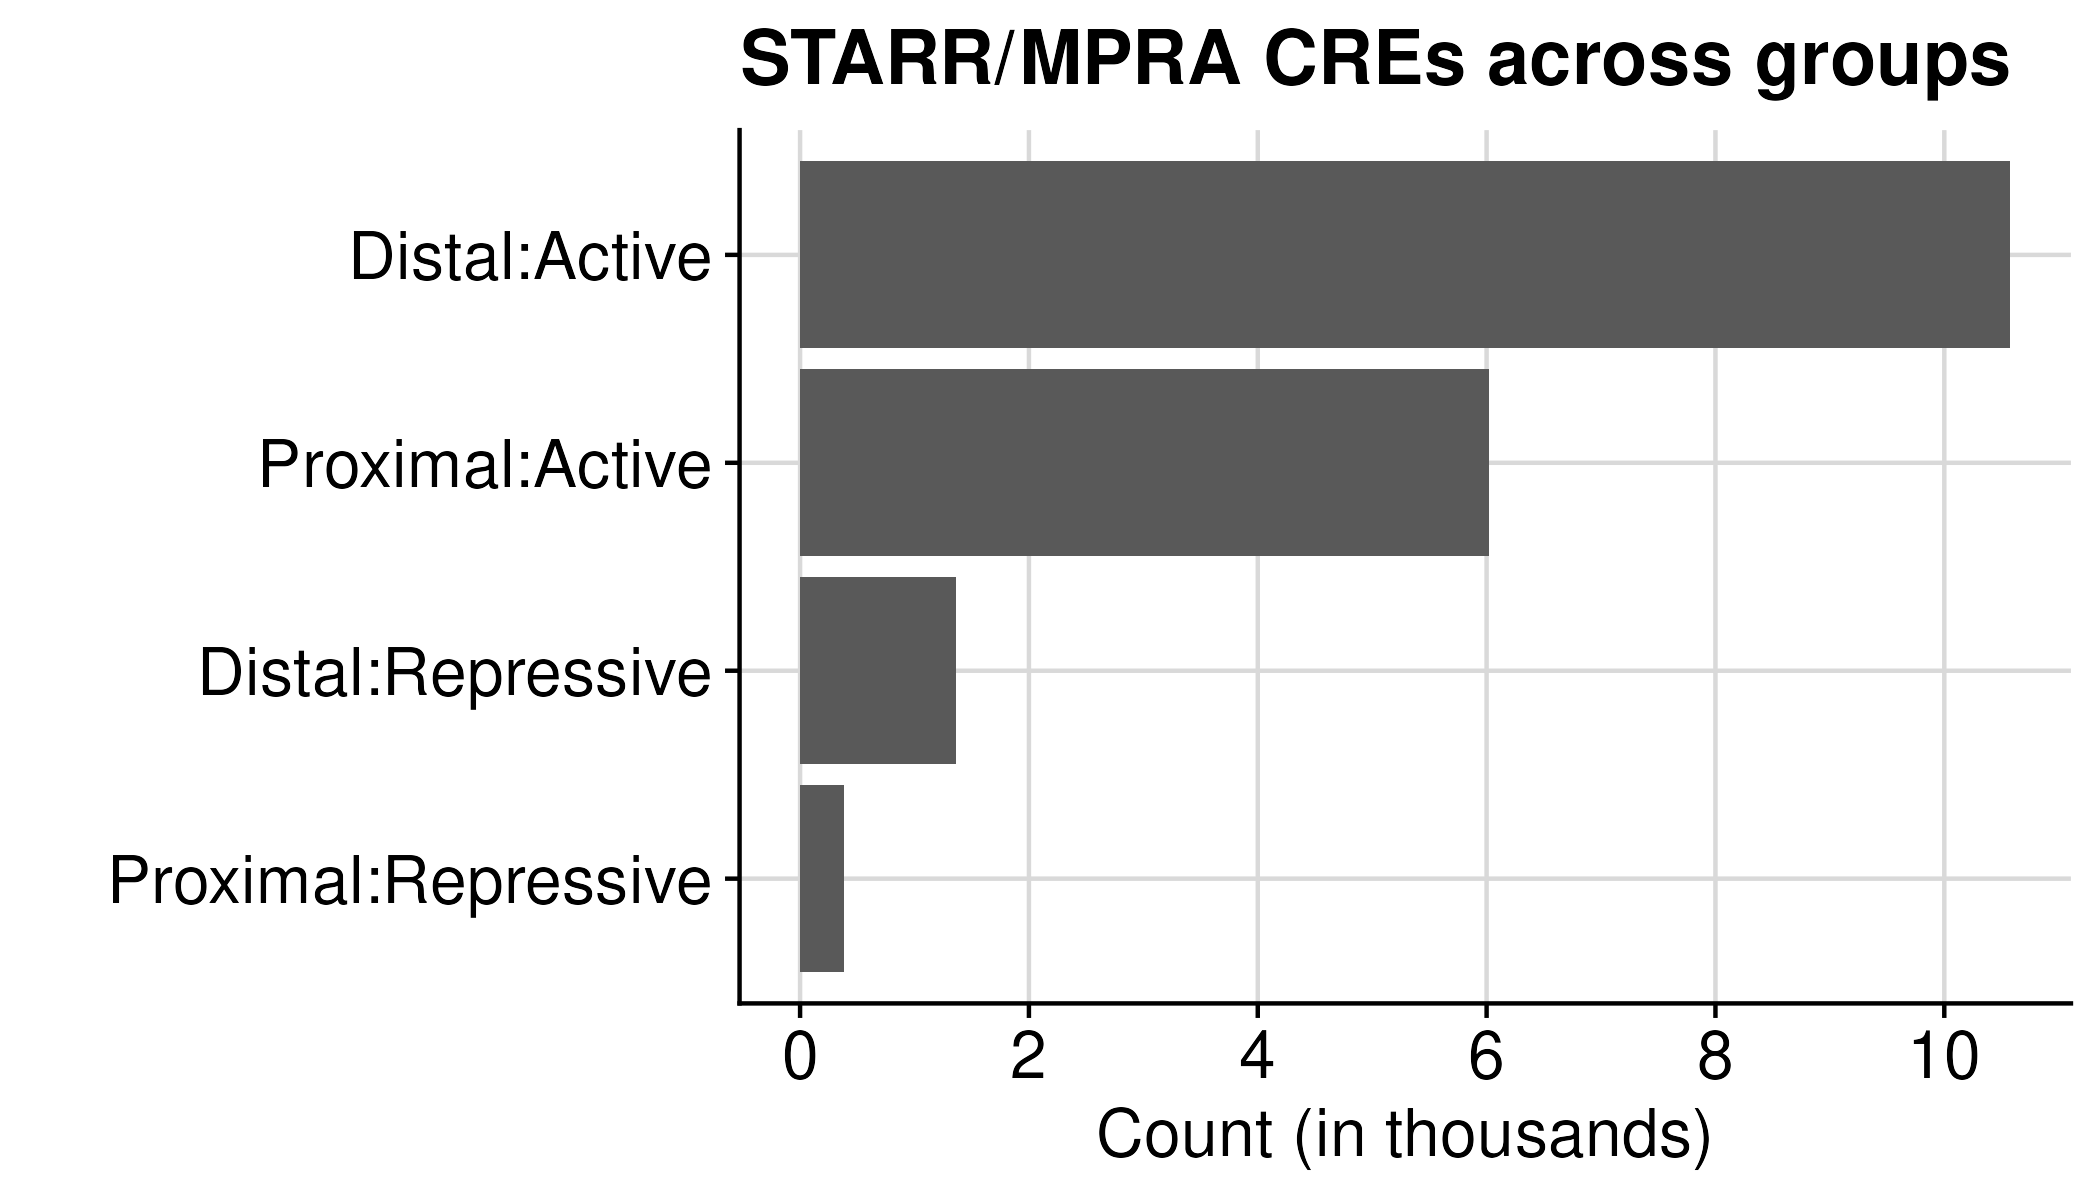
Proximal/Distal-Active/Repressive CREs
To be more stringent and ensure less overlap, we only consider regions with only active peaks or repressive peaks.
count table
| Group | ATAC (Overlap) | ATAC (Union) |
|---|---|---|
| Distal:Active | 11,435 | 12,290 |
| Distal:Repressive | 1,613 | 2,725 |
| Proximal:Active | 5,162 | 5,145 |
| Proximal:Repressive | 136 | 143 |
Using ATAC (Overlap) as final STARR/MPRA CRE table (Total regions: 18,341)
| Group | Count |
|---|---|
| Distal:Active | 11,435 |
| Distal:Repressive | 1,613 |
| Proximal:Active | 5,162 |
| Proximal:Repressive | 136 |
Since we use a more stringent criteria (i.e. remove AR), there were only 5 regions apear to be double counted
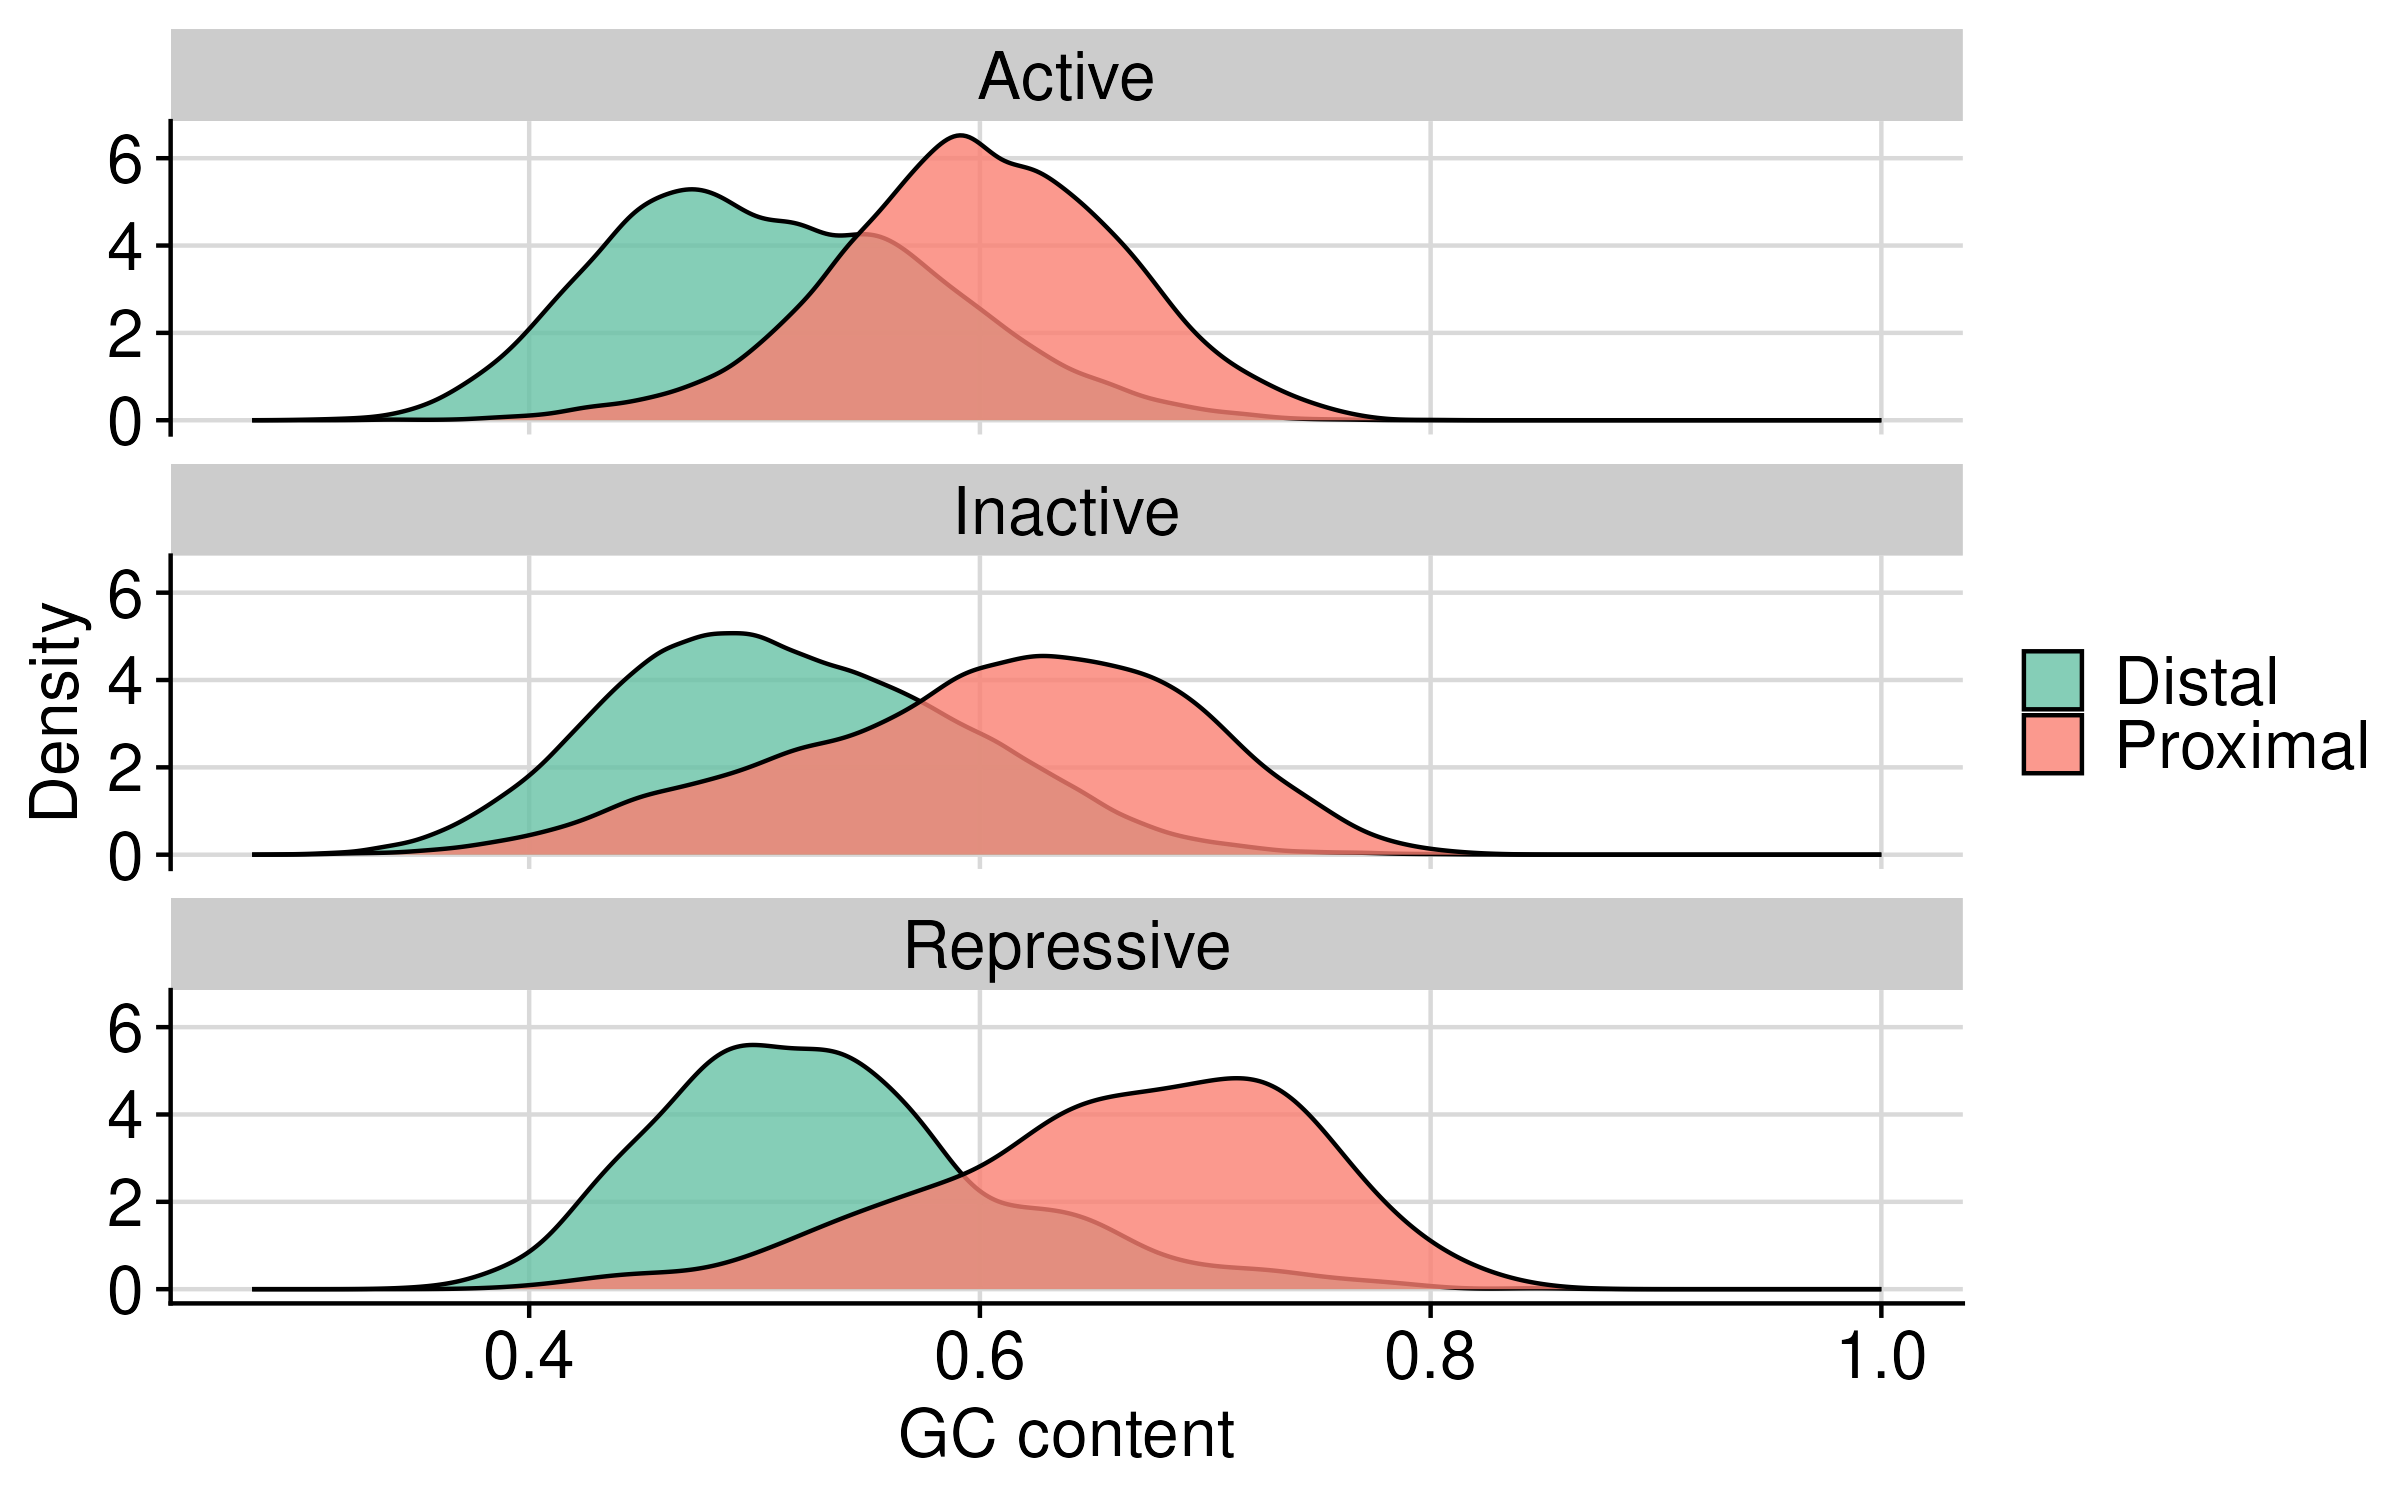
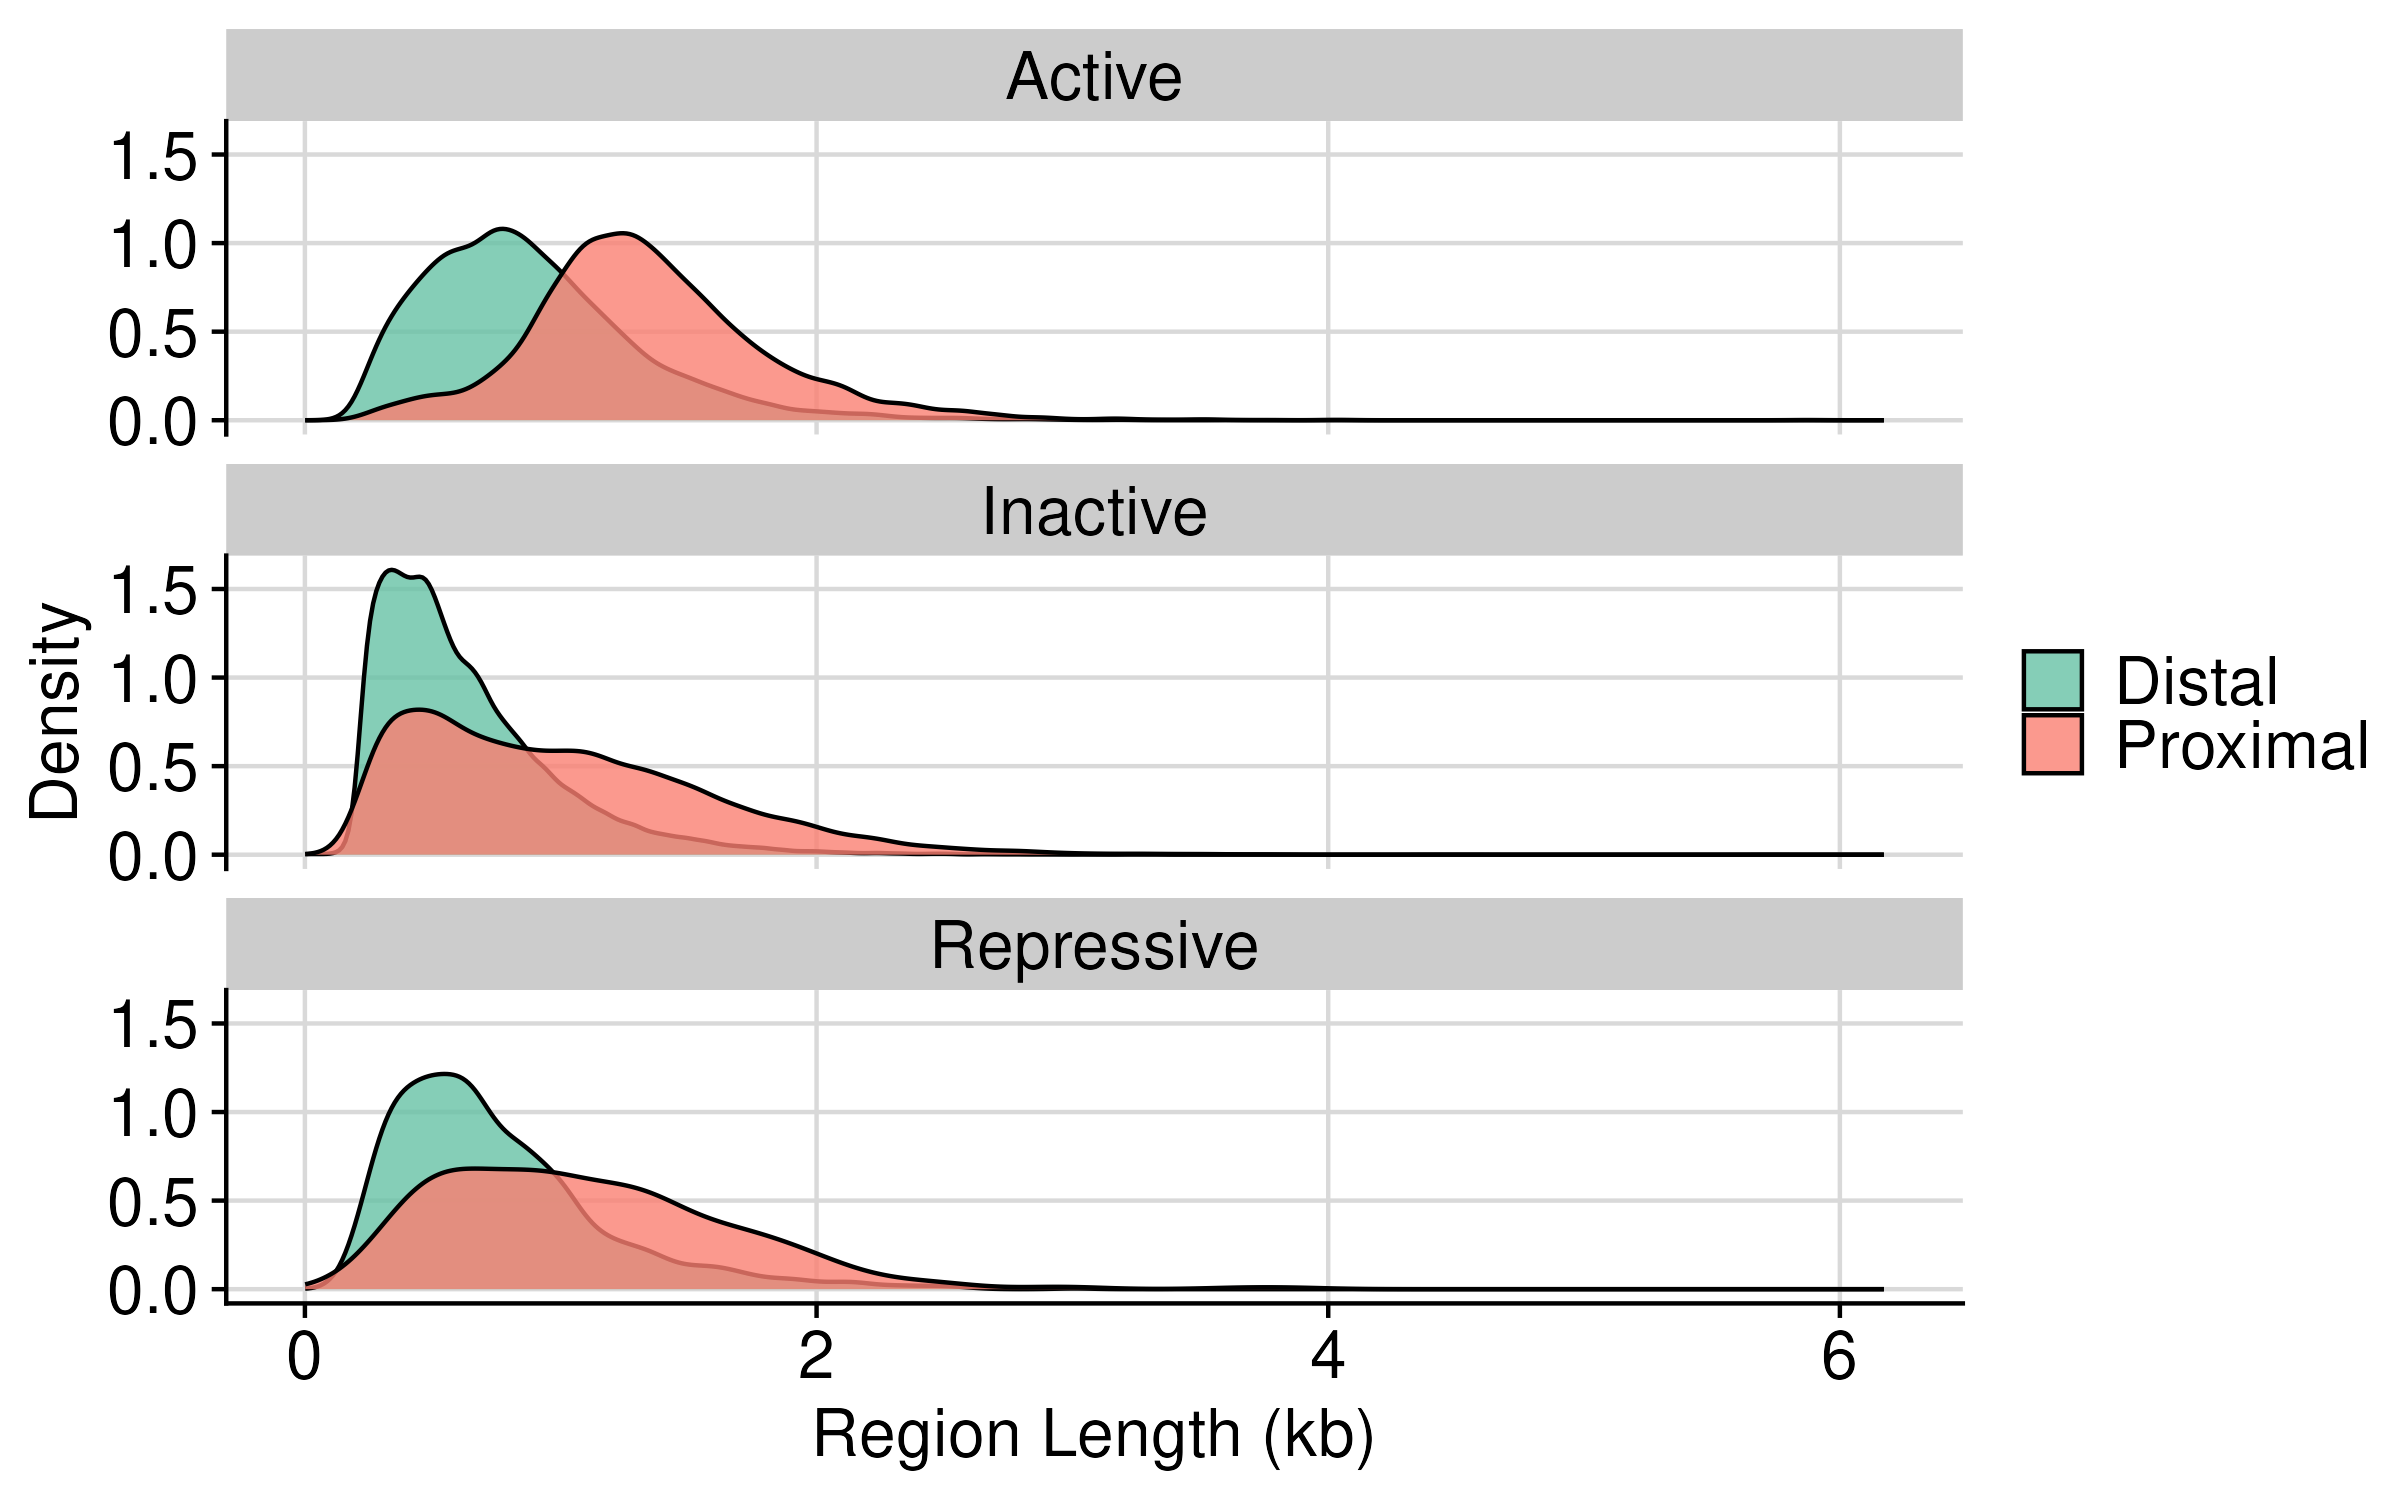
Distribution of gc content and region length
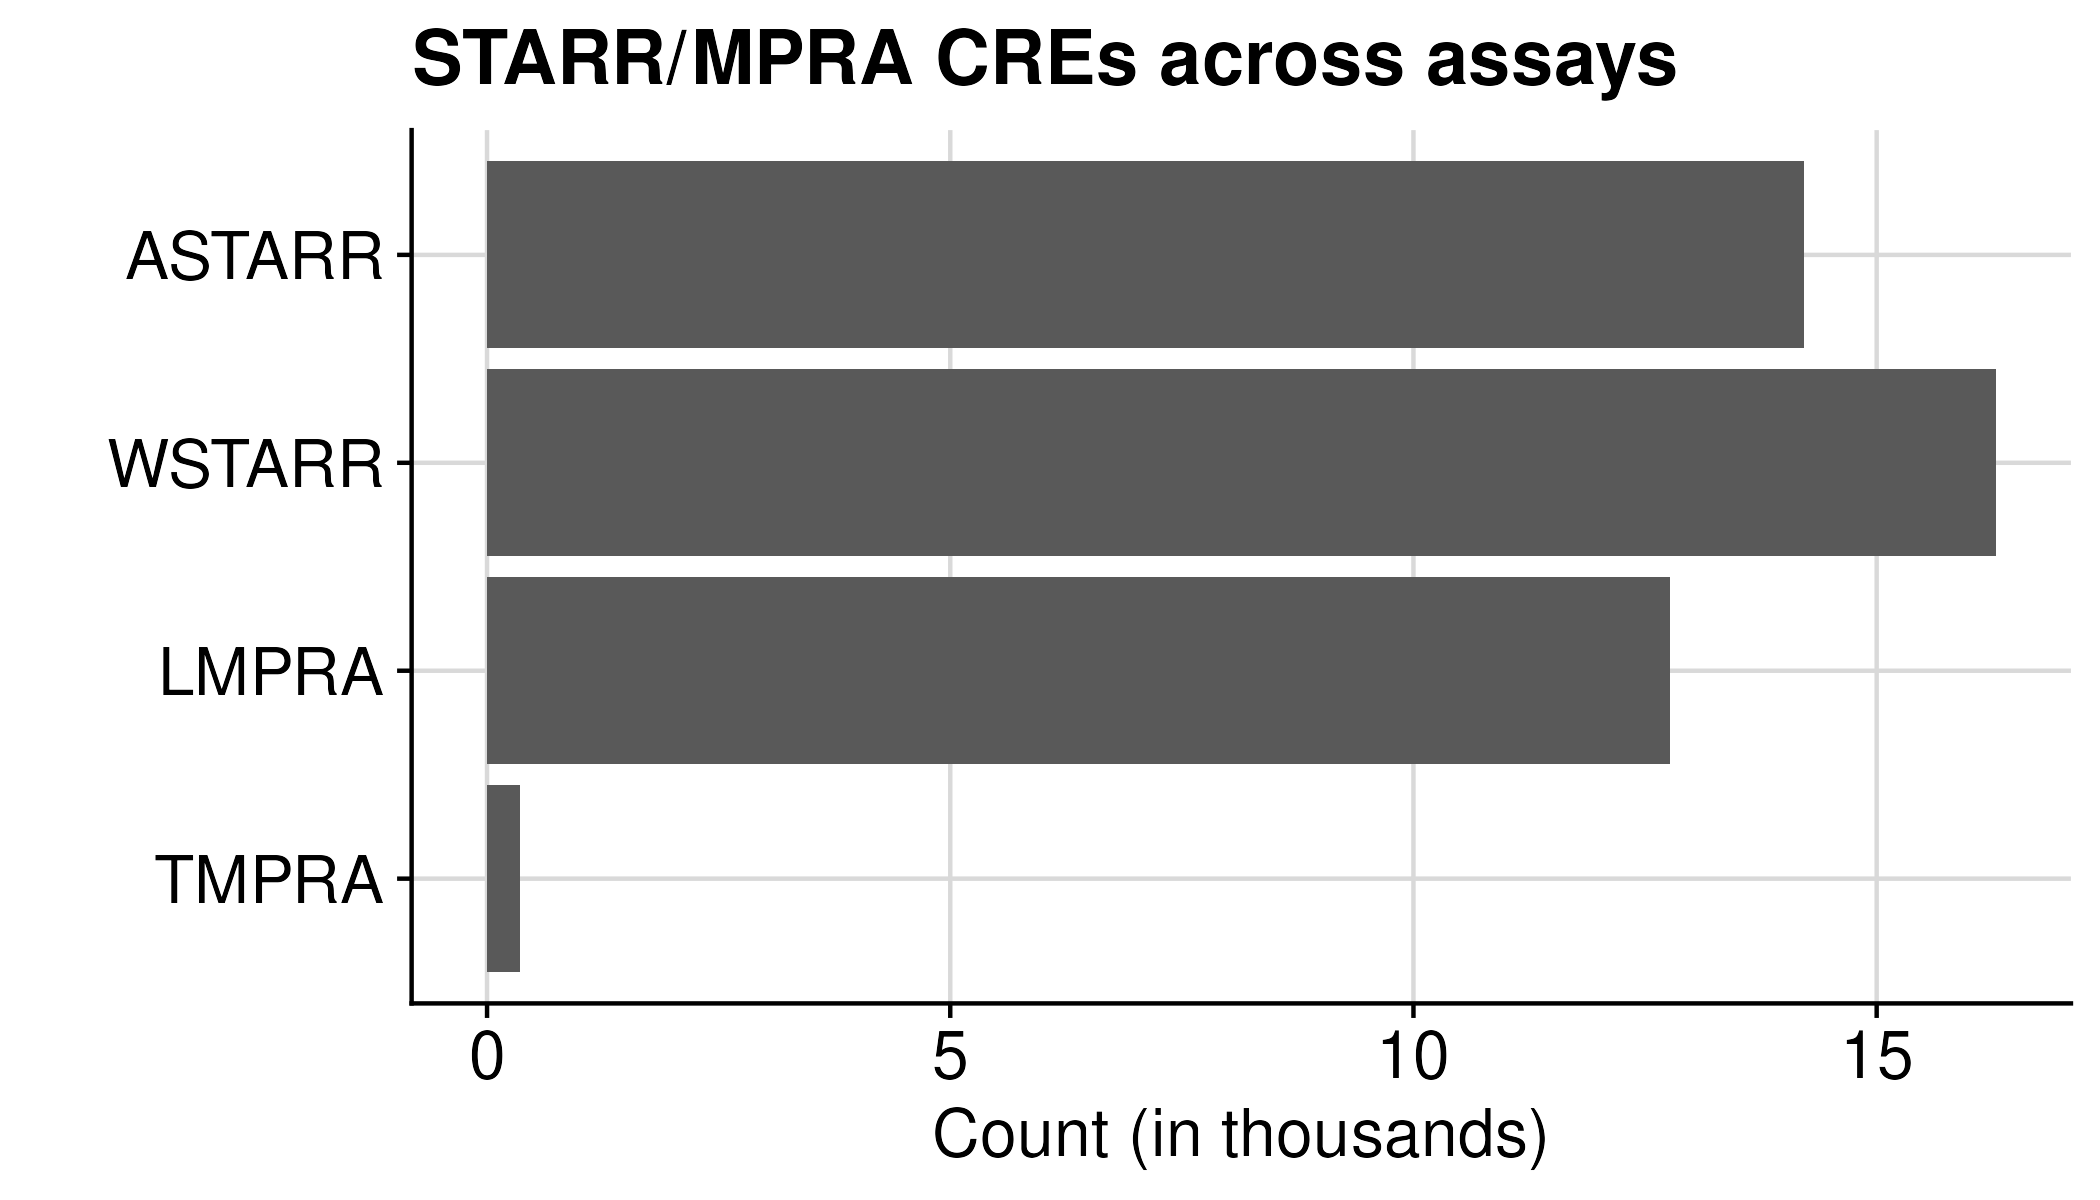
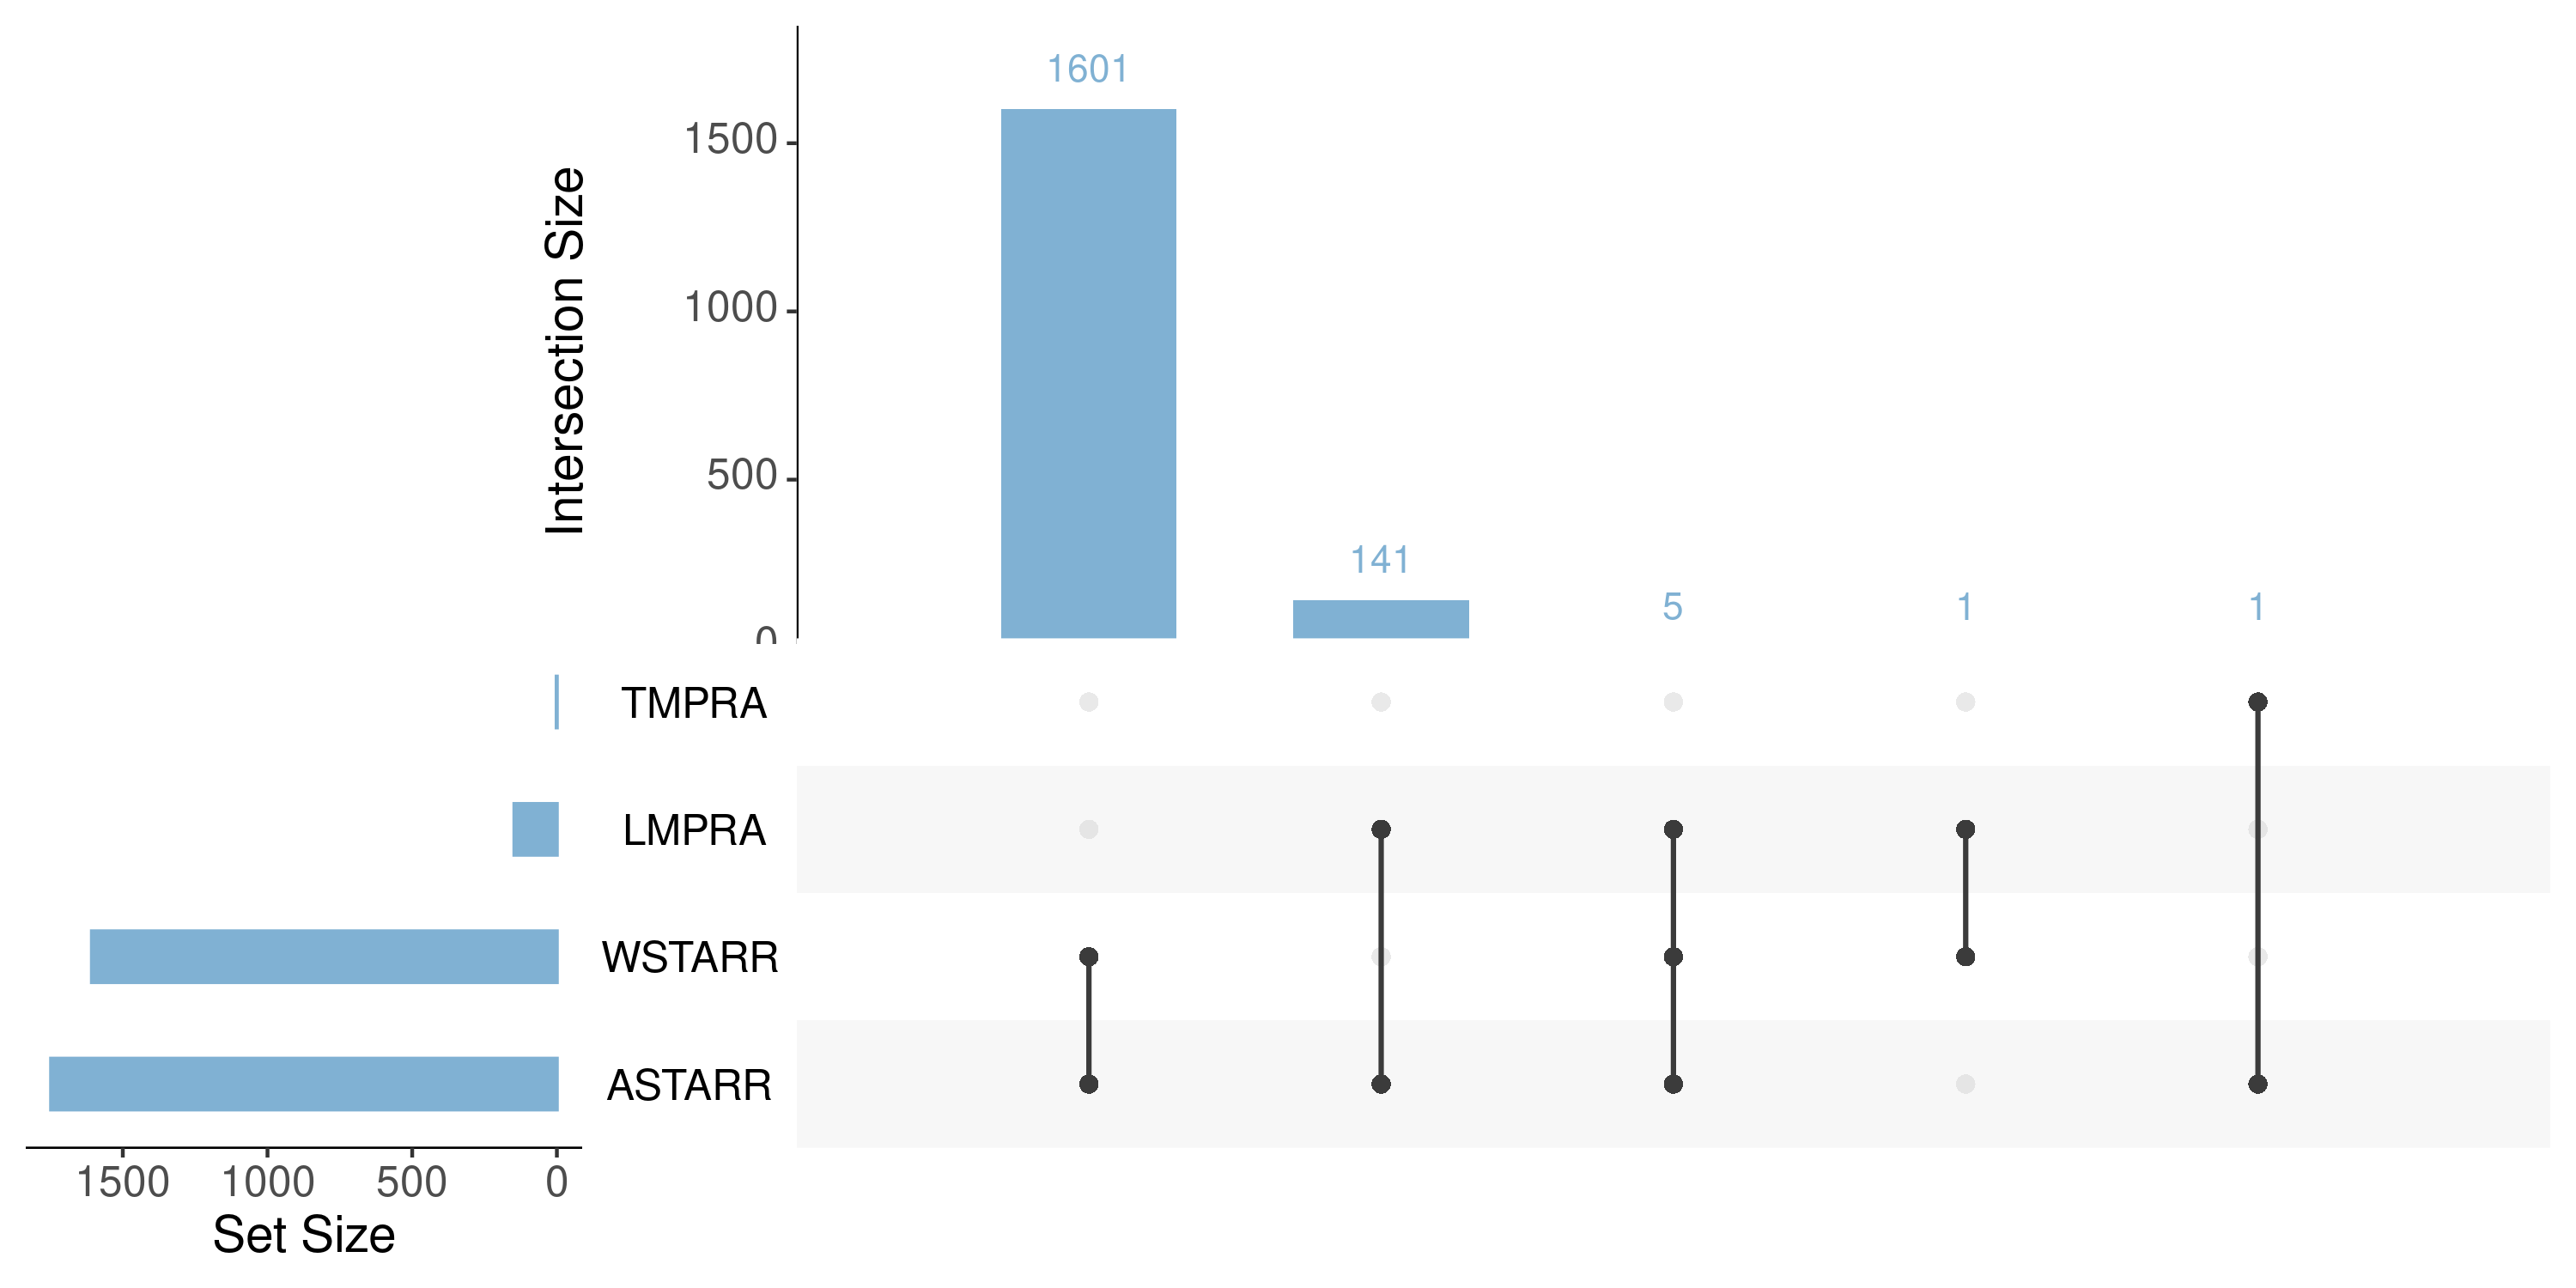
We could further view CREs across each assay
| Group | Count |
|---|---|
| ASTARR | 14,220 |
| WSTARR | 16,283 |
| LMPRA | 12,764 |
| TMPRA | 360 |
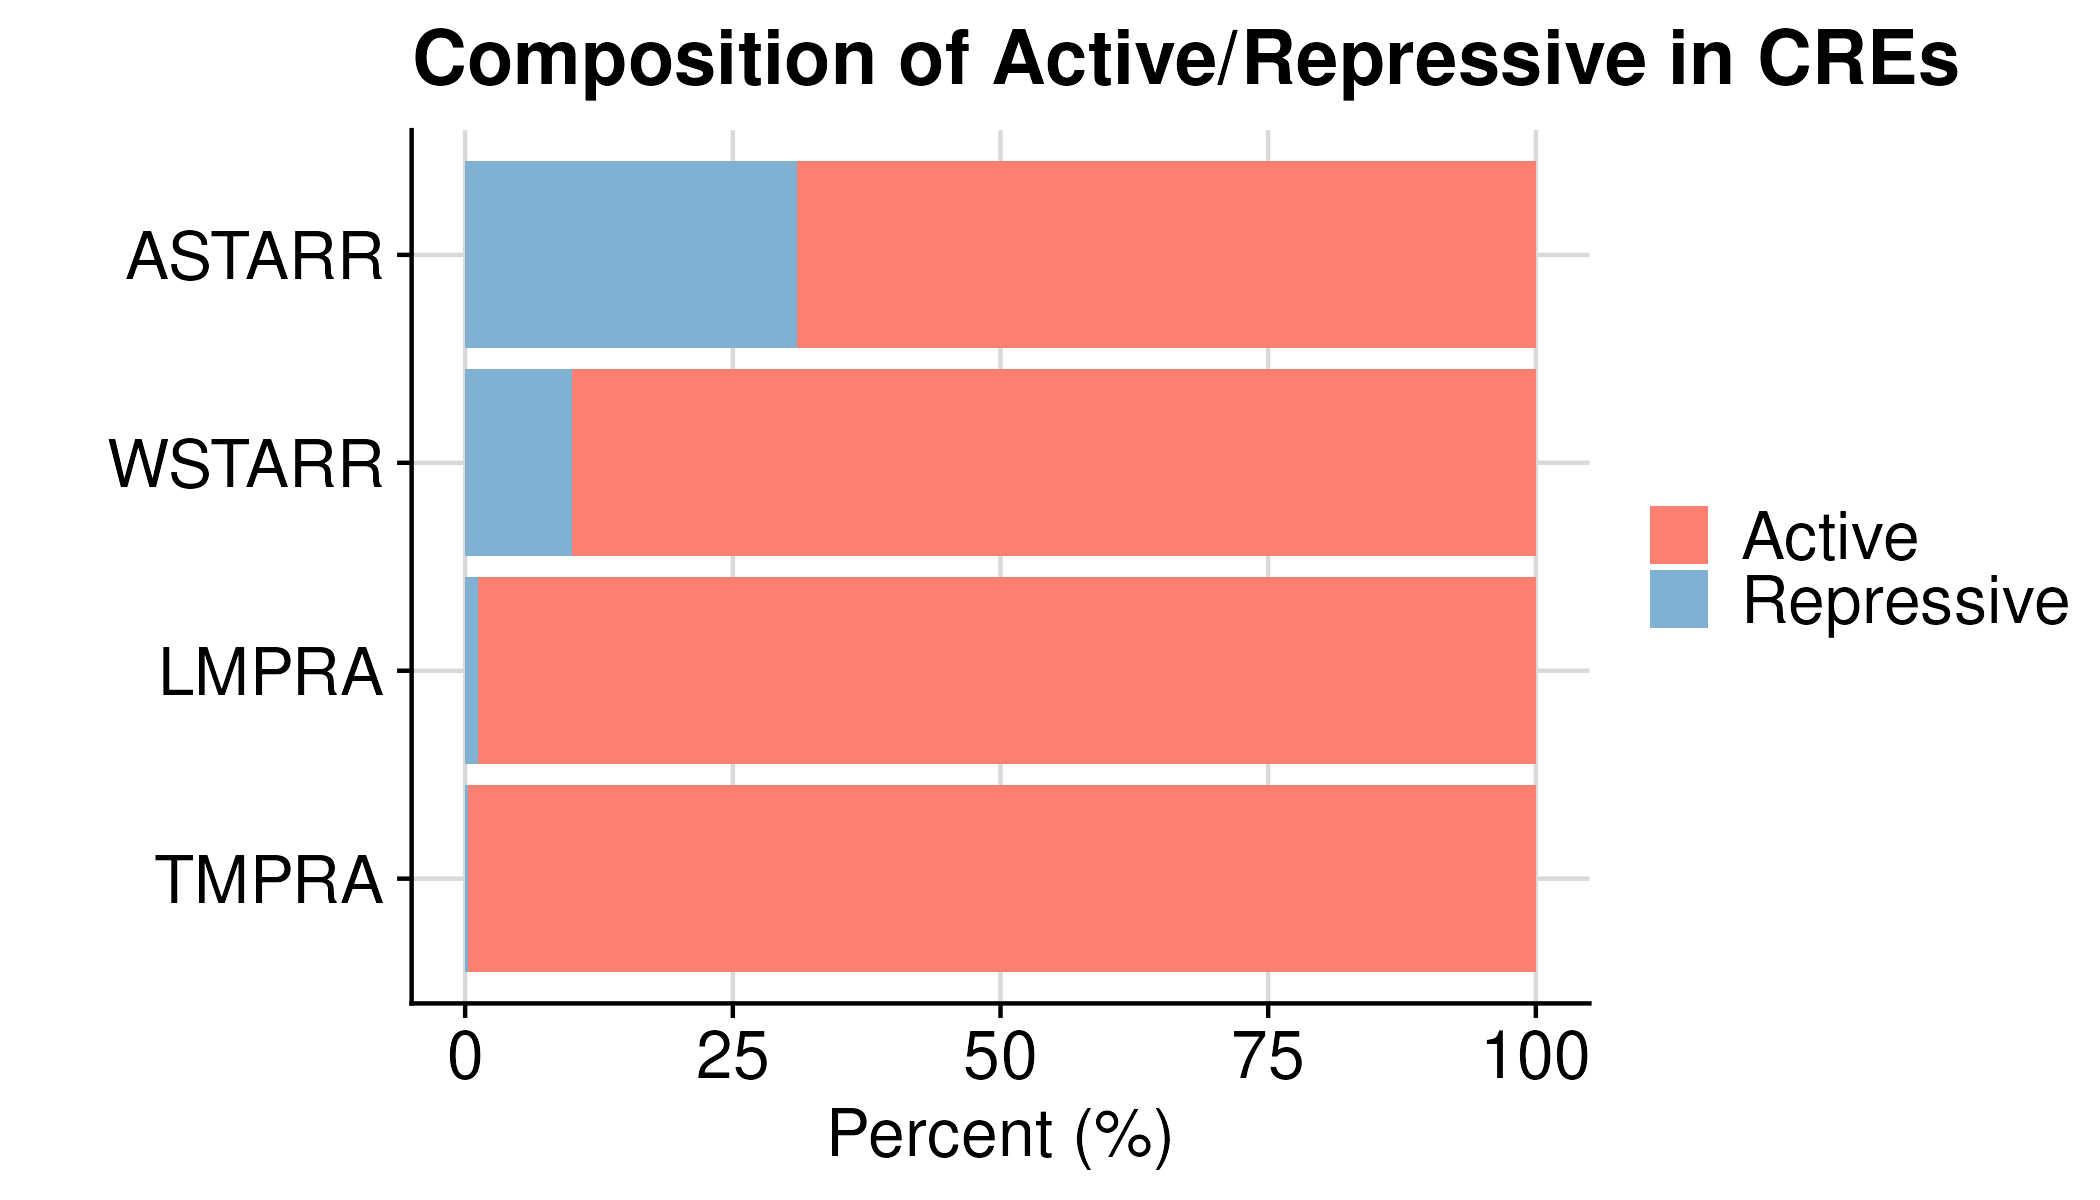
If break each by assay direction
| Group | Active | Repressive |
|---|---|---|
| ASTARR | 69% | 31% |
| LMPRA | 99% | 1% |
| TMPRA | 99.7% | 0.3% |
| WSTARR | 90% | 10% |
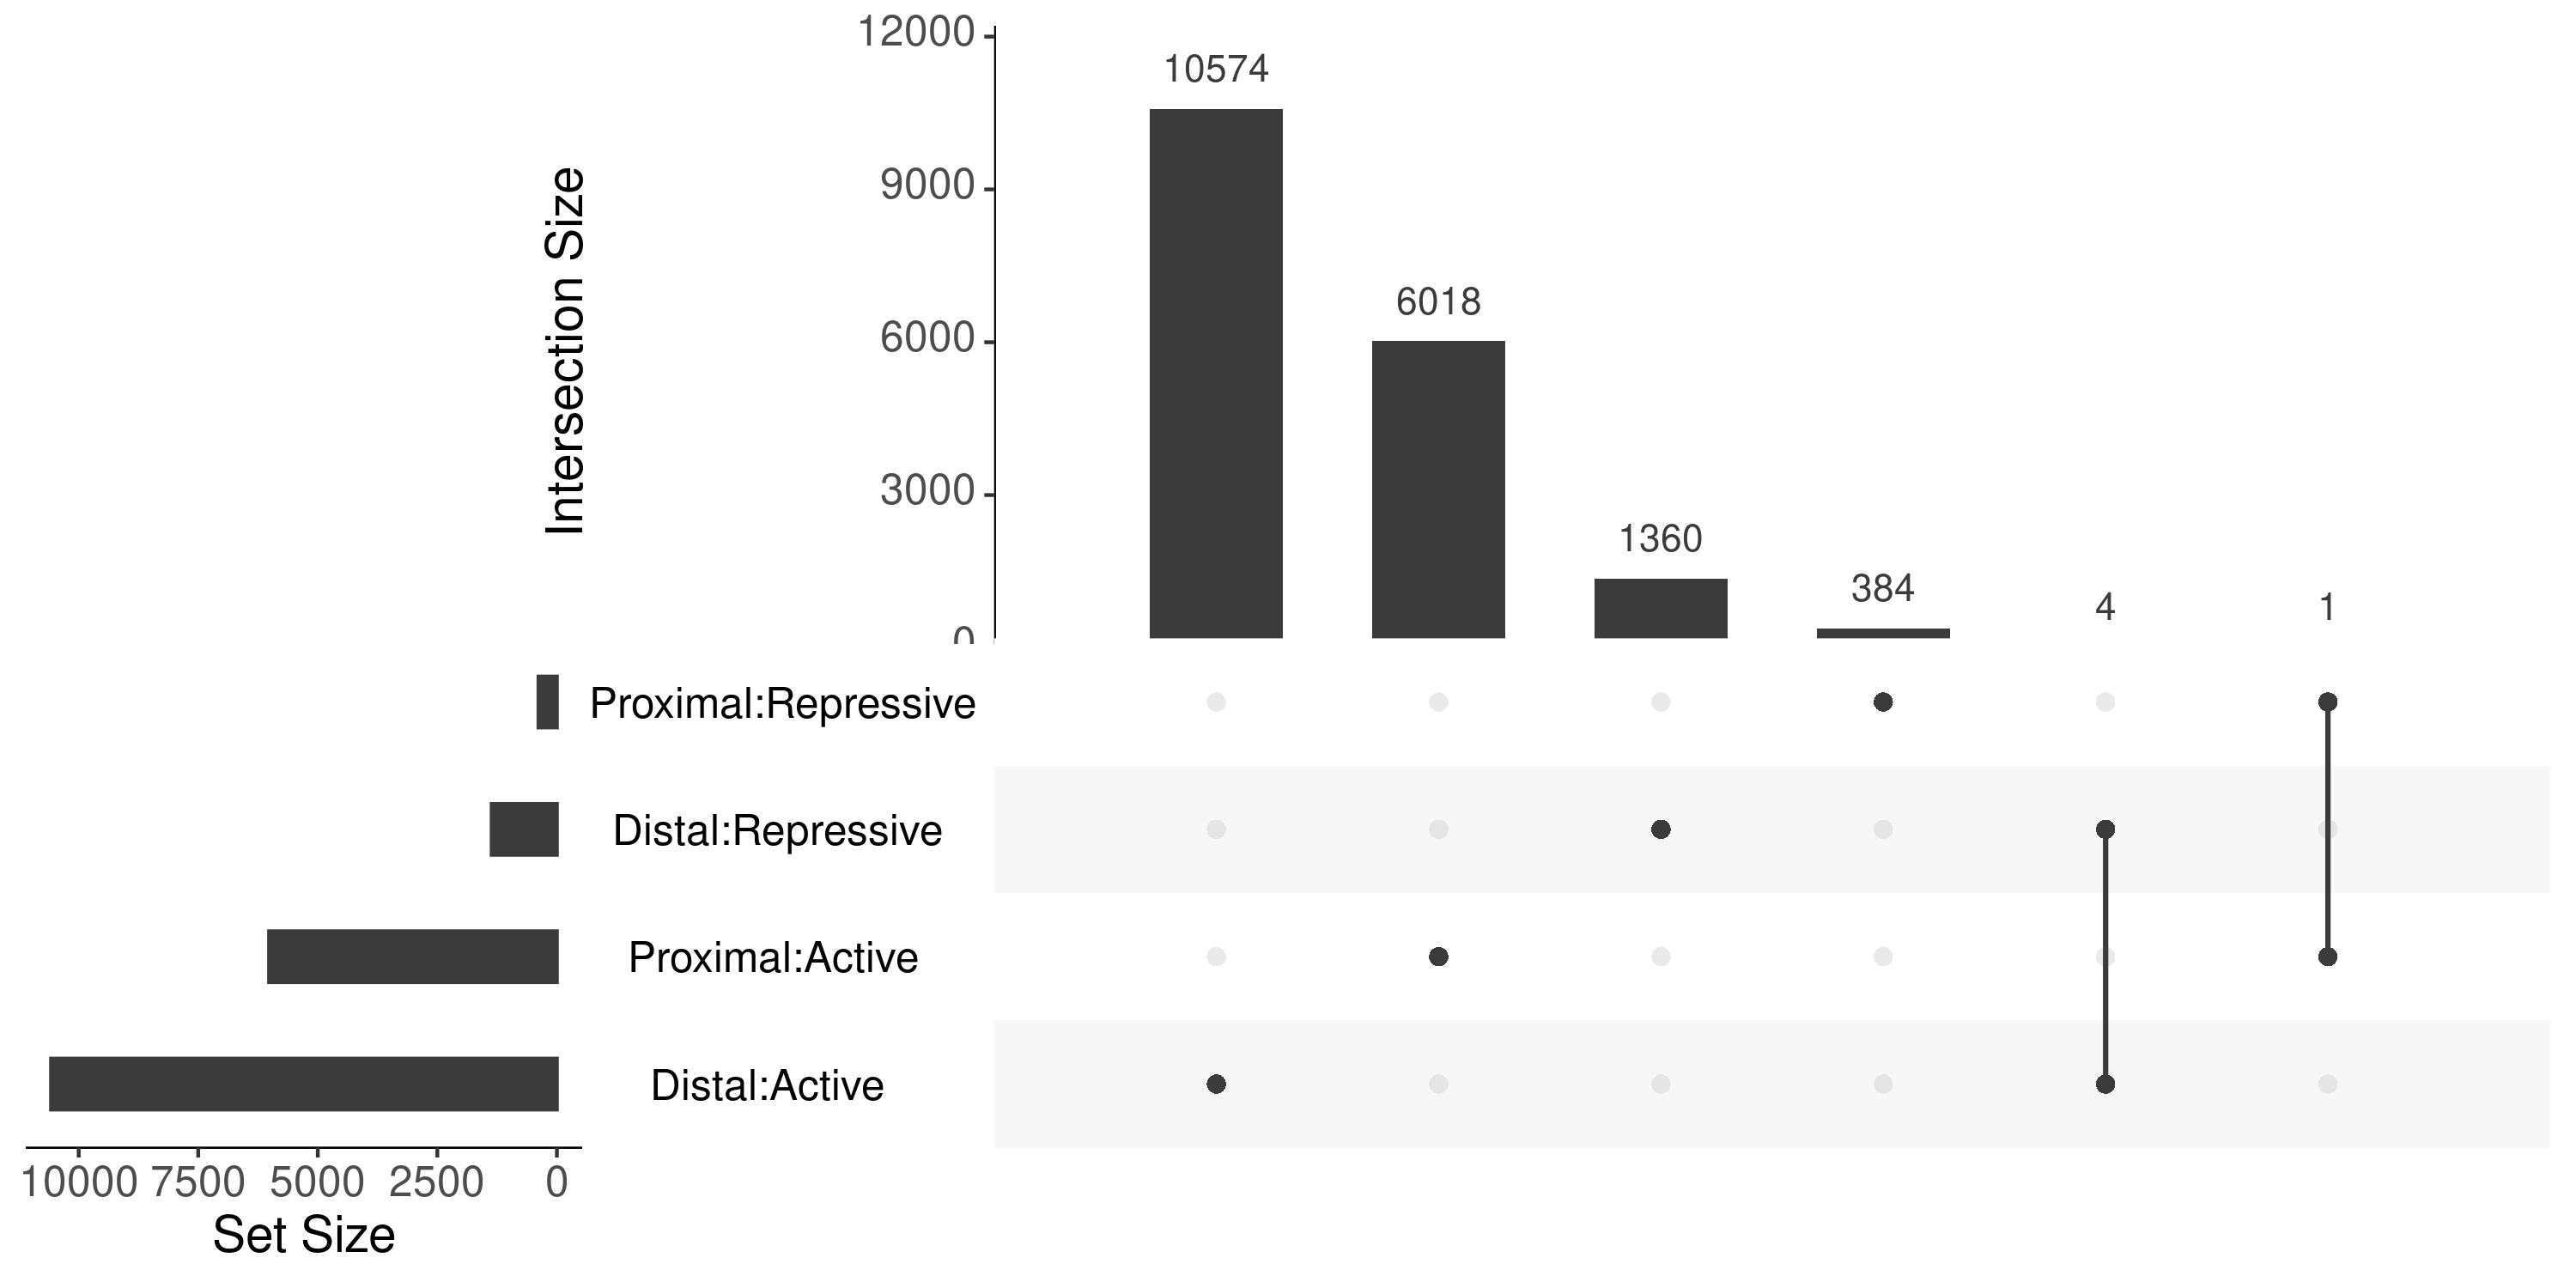
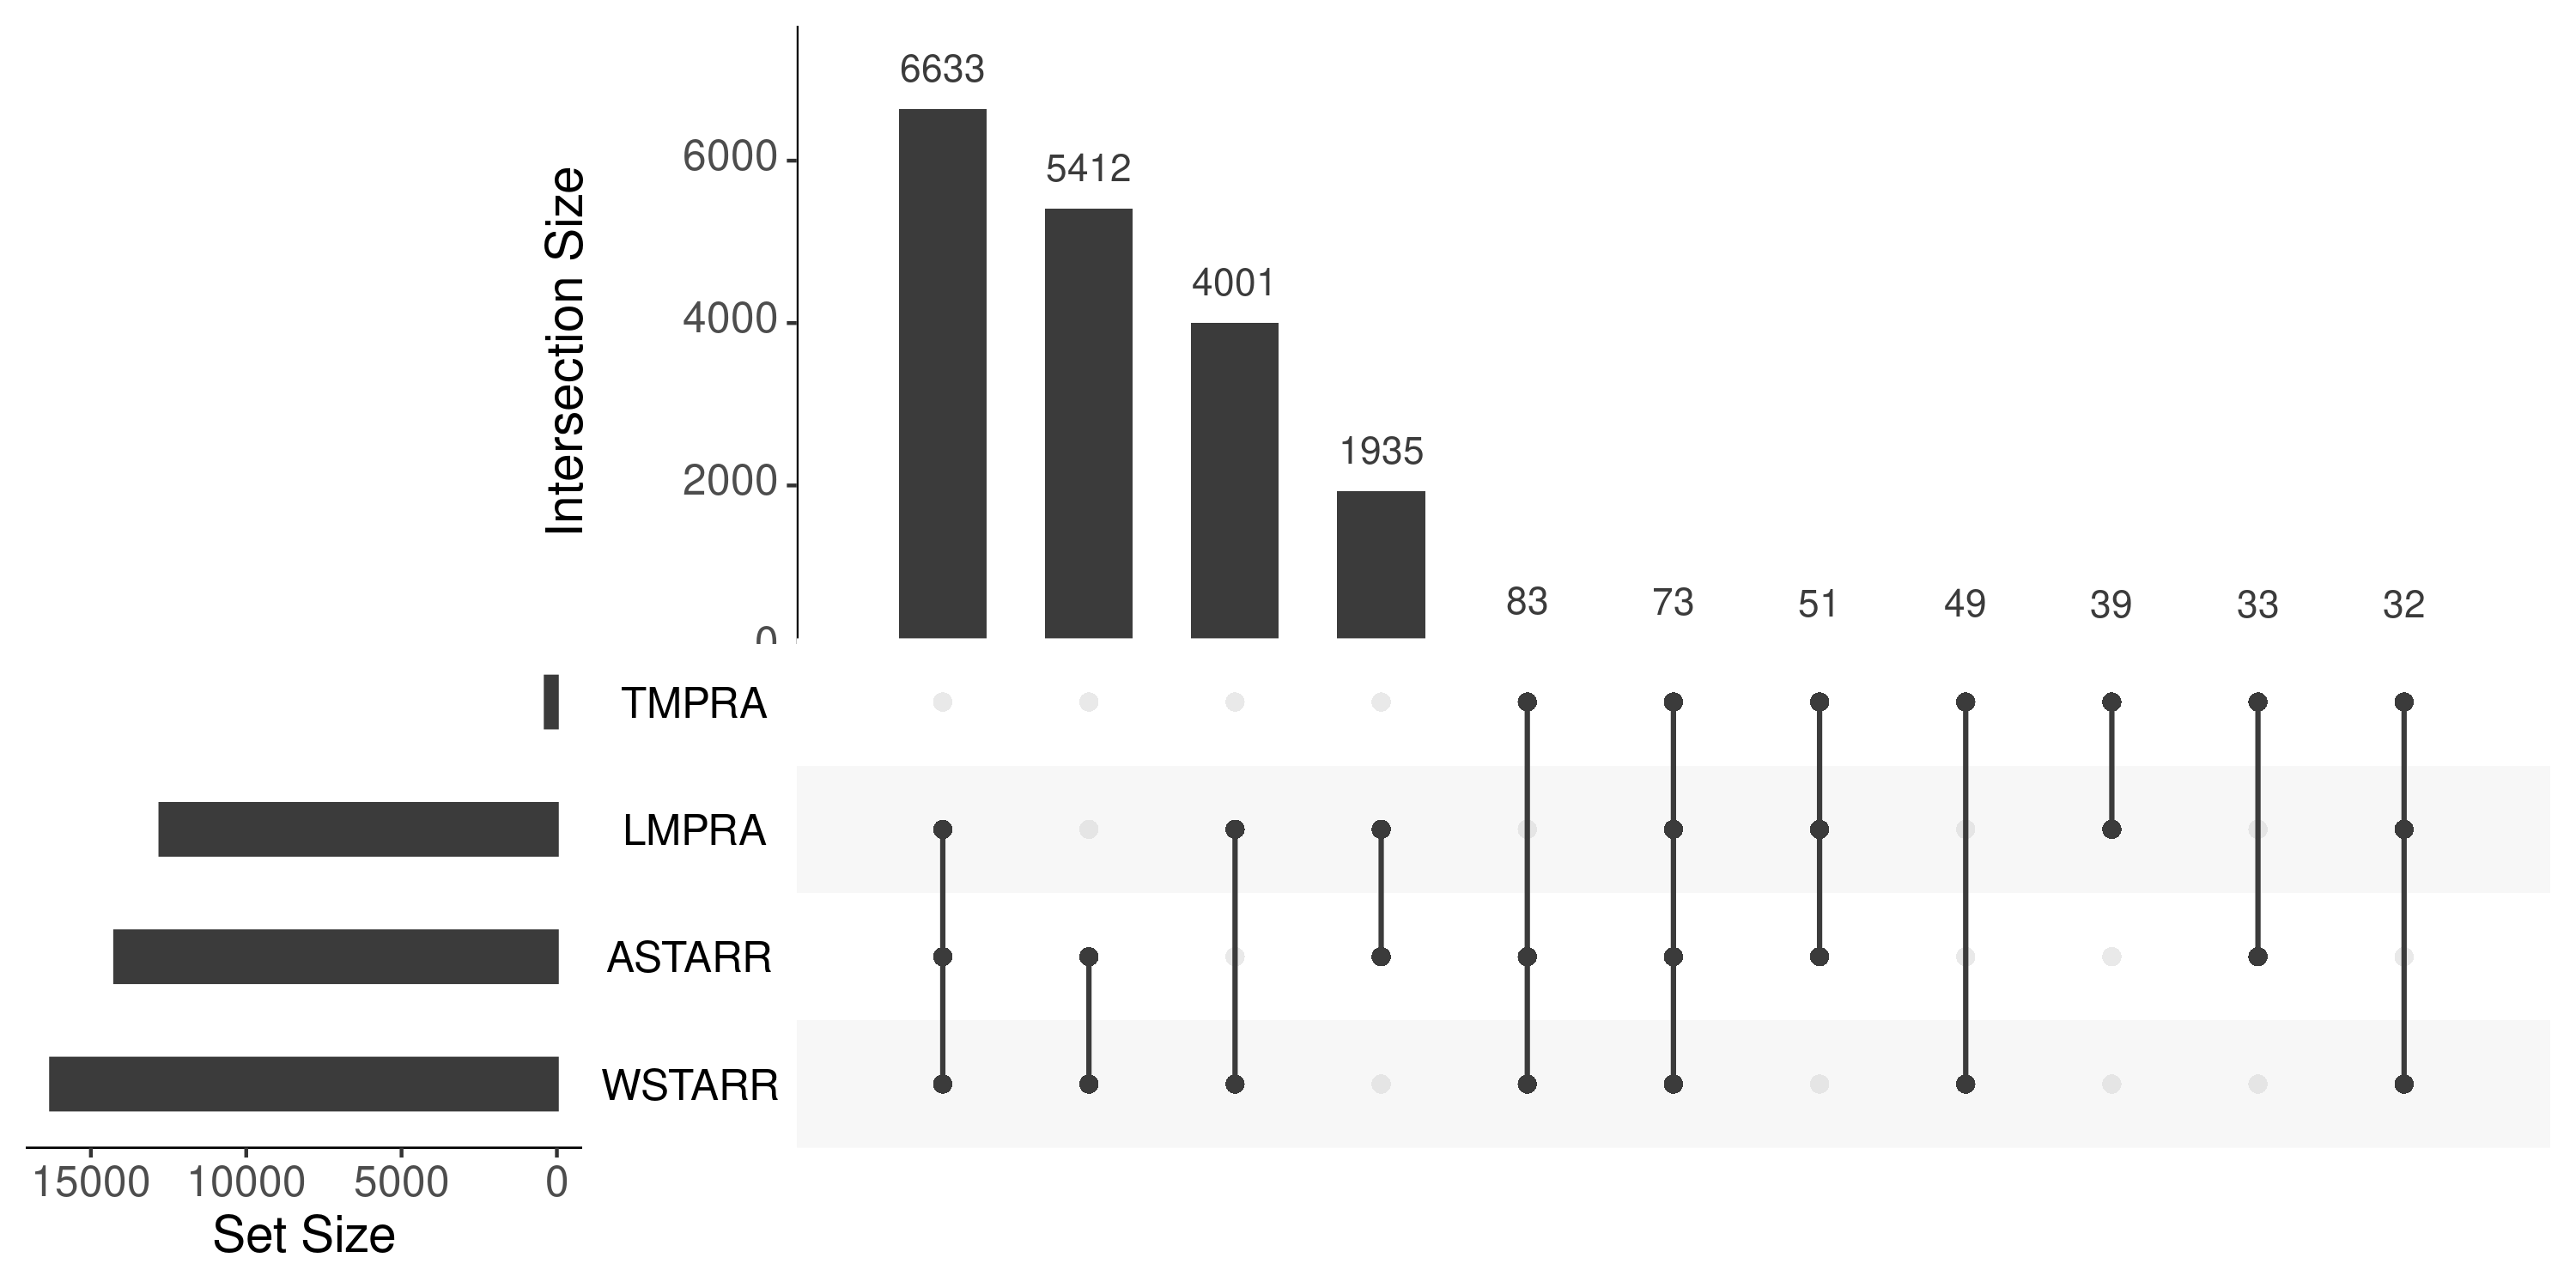
upset plot (total)
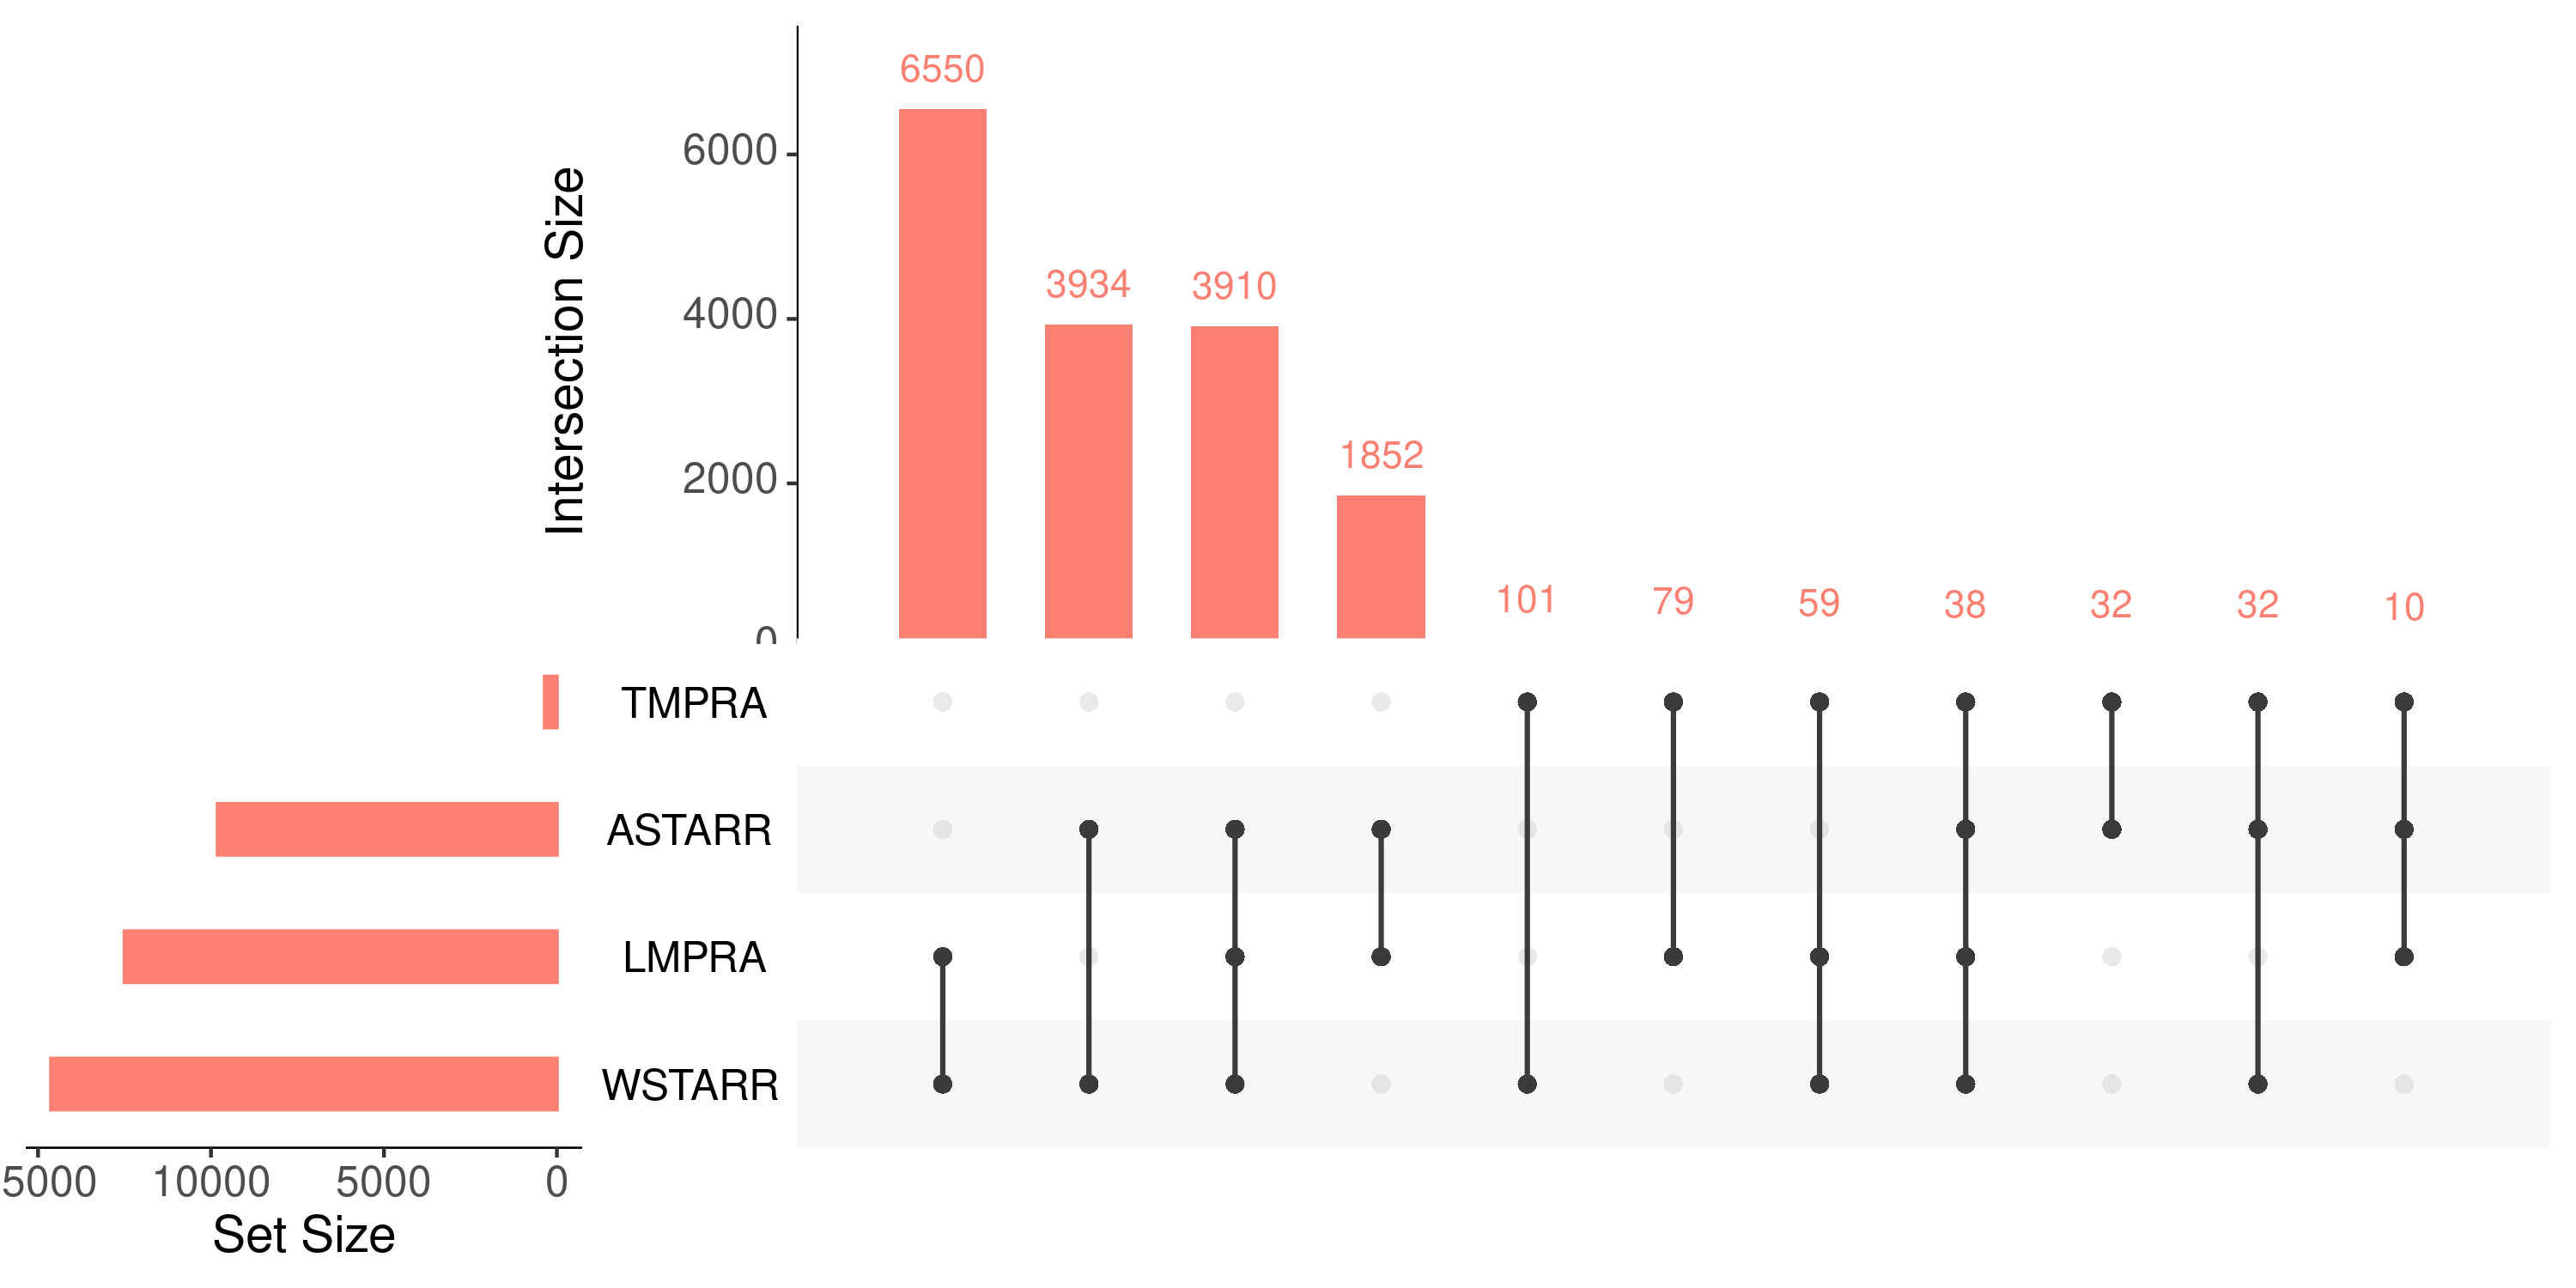
upset plot (active)
upset plot (repressive)
- brainstorm todo list
- enrichment
- number of TSS
- obs/exp of chromatin states
- matrix of log2; significant one
- looping: cross and withing
- -> matrix and loop count
- enrichment