| Label | Assay | Direction | Count |
|---|---|---|---|
| ASTARR_A | ATAC-STARR-seq | Active (either direction) | 35505 |
| ASTARR_AB | ATAC-STARR-seq | Active (both direction) | 11680 |
| ASTARR_R | ATAC-STARR-seq | Repressive (either direction) | 154337 |
| ASTARR_RB | ATAC-STARR-seq | Repressive (both direction) | 28775 |
| eSTARR_A | eSTARR-seq | Active (either direction) | 150 |
| eSTARR_AB | eSTARR-seq | Active (both direction) | 31 |
| eSTARR_R | eSTARR-seq | Repressive (either direction) | 341 |
| eSTARR_RB | eSTARR-seq | Repressive (both direction) | 65 |
| LMPRA_A | Lenti-MPRA | Active (either direction) | 25648 |
| LMPRA_AB | Lenti-MPRA | Active (both direction) | 16603 |
| LMPRA_R | Lenti-MPRA | Repressive (either direction) | 485 |
| LMPRA_RB | Lenti-MPRA | Repressive (both direction) | 128 |
| TMPRA_A | Tiling-MPRA | Active (either direction) | 6017 |
| TMPRA_AB | Tiling-MPRA | Active (both direction) | 57 |
| TMPRA_R | Tiling-MPRA | Repressive (either direction) | 254 |
| TMPRA_RB | Tiling-MPRA | Repressive (both direction) | 1 |
| WSTARR_A | WHG-STARR-seq | Active (either direction) | 79738 |
| WSTARR_AB | WHG-STARR-seq | Active (both direction) | 25505 |
| WSTARR_R | WHG-STARR-seq | Repressive (either direction) | 62201 |
Peak calling
This page provides an overview of the peak calling methodologies applied to our functional characterization data. Our approach incorporates the results from various screen analysis tools to ensure comprehensive analysis for assay comparisons.
Unified processing pipeline for peak calling in high-throughput reporter assays
An unified processing pipeline has been developed by Junke from the Yu Lab to standardize the enhancer calling process for high-throughput reporter assays.
deep_ATAC_STARR_seq.genomic_bin_100_sliding_10.tar.gz
lentiMPRA.tar.gz
tilingMPRA_MYC_GATA.tar.gz
tilingMPRA_OL13.tar.gz
tilingMPRA_OL45.tar.gz
WHG_STARR_TR.tar.gz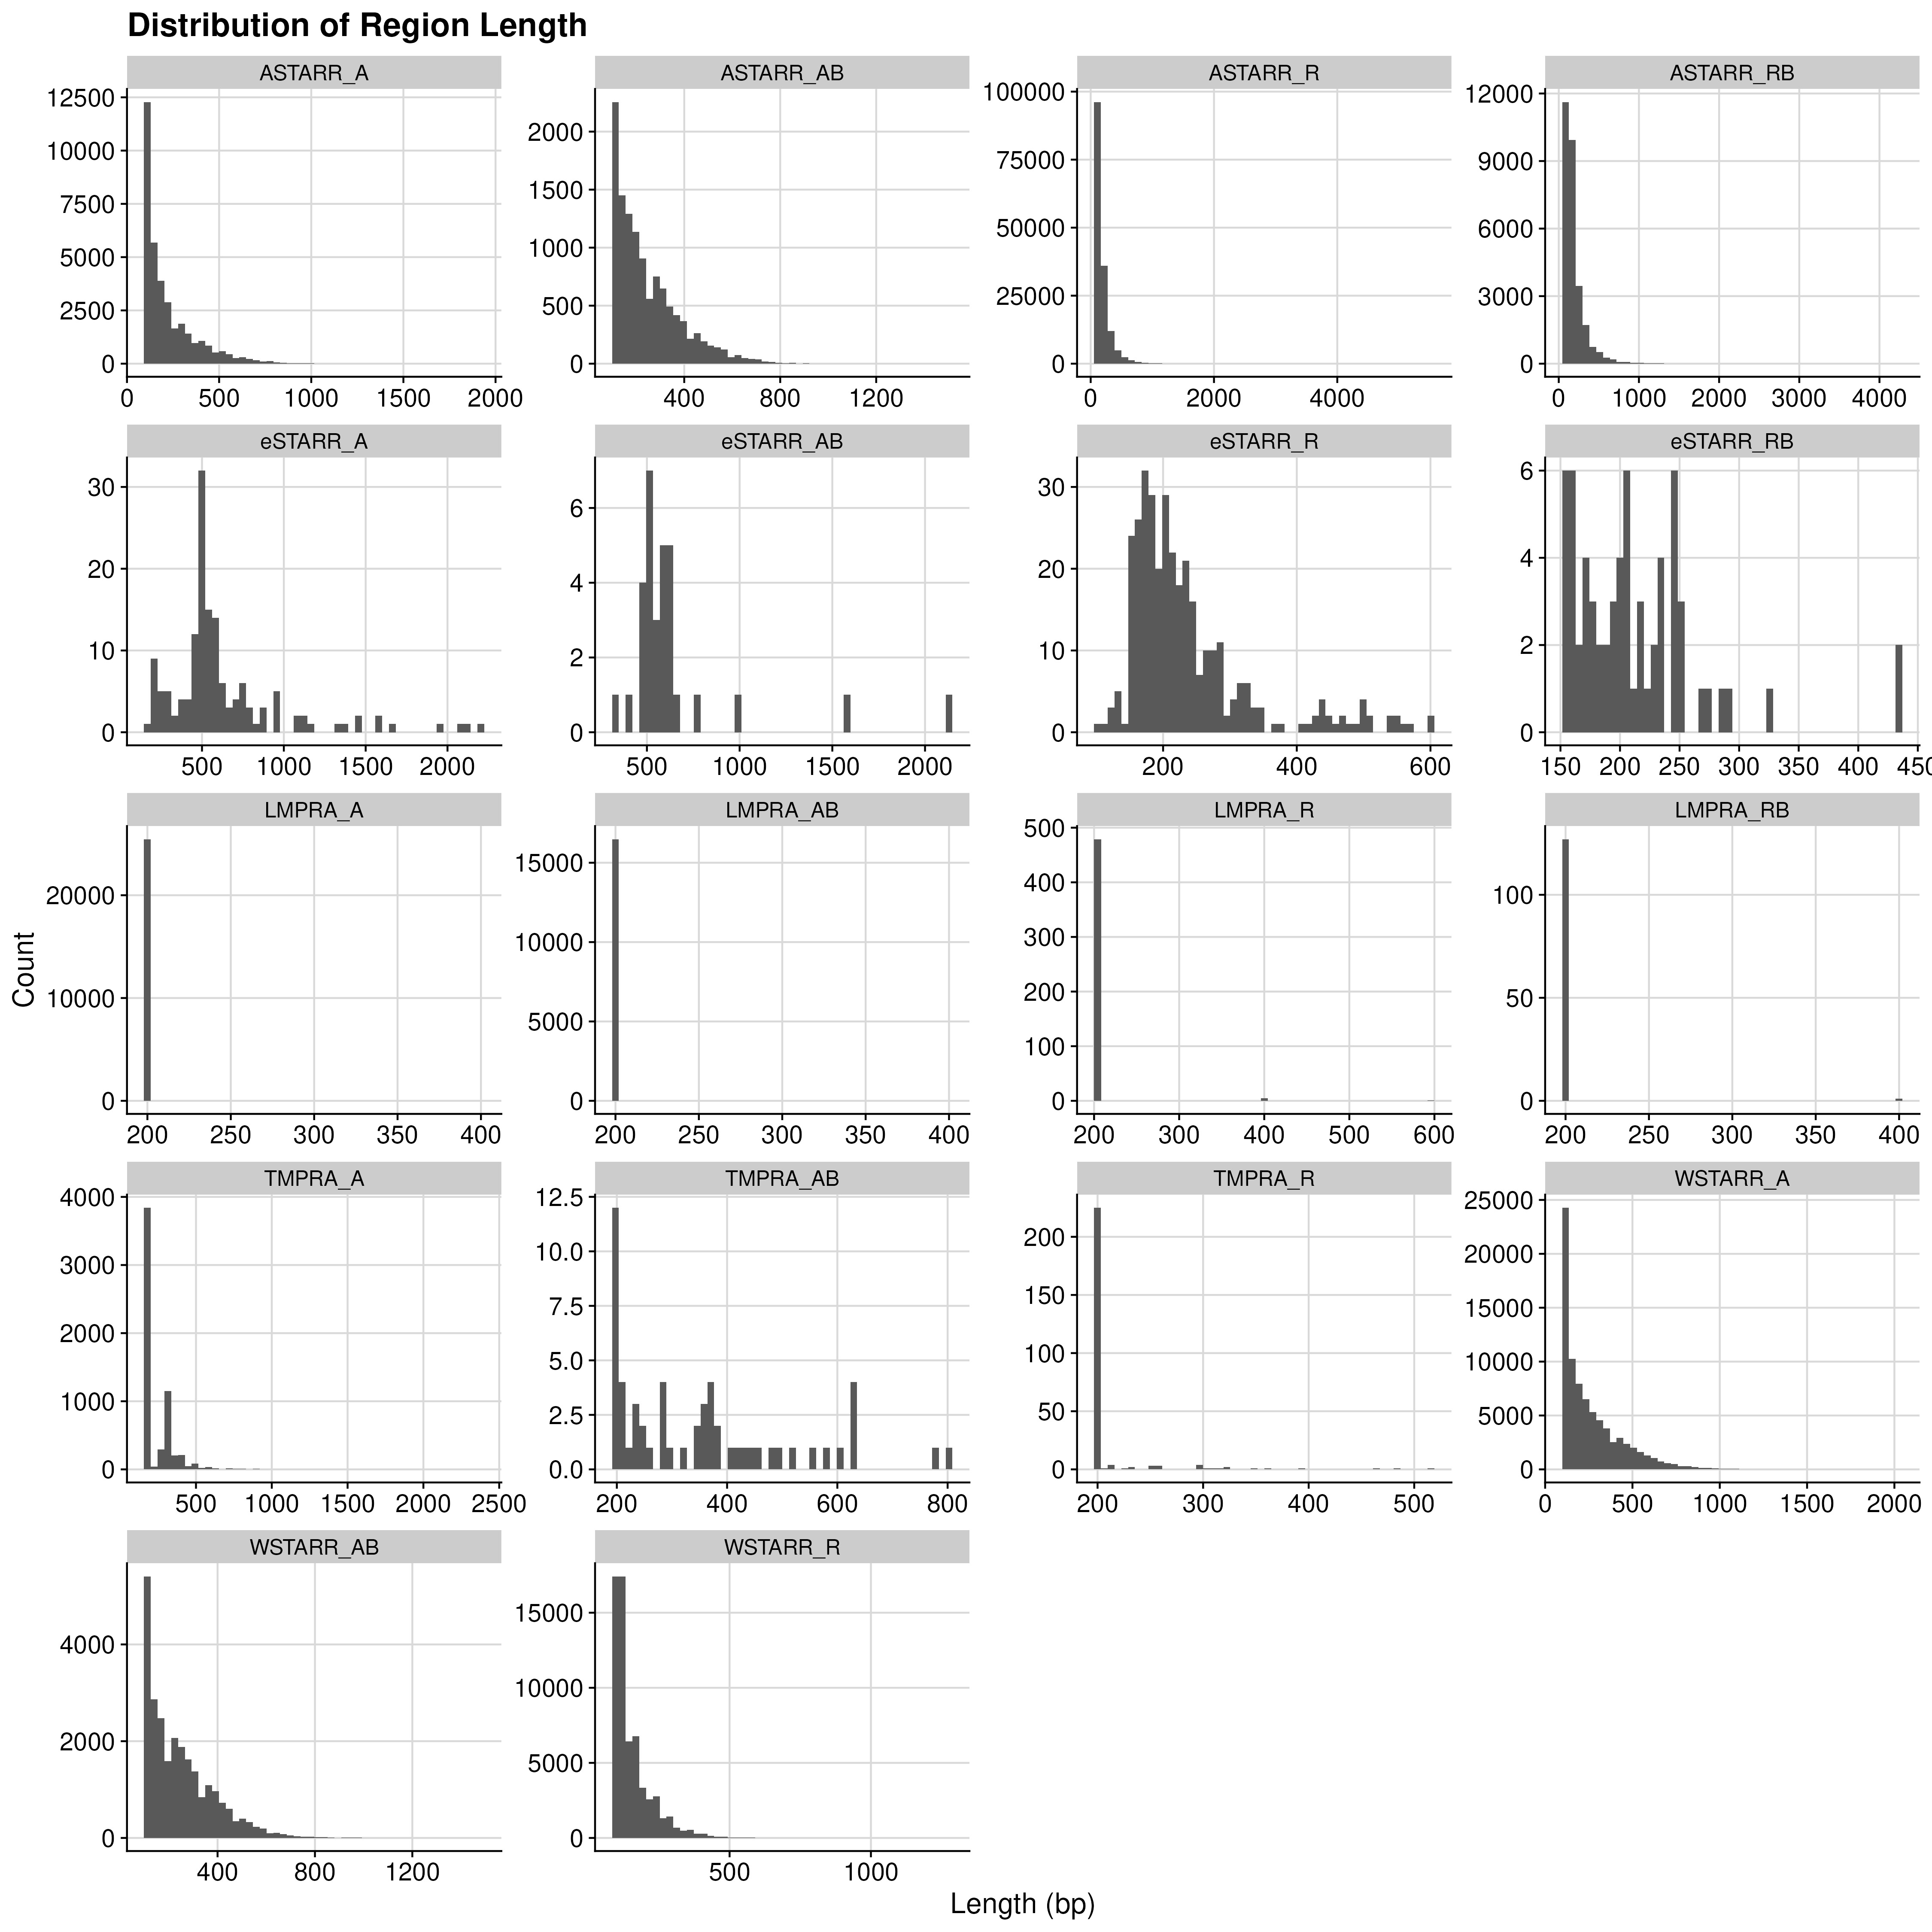
In this study we are going to use only “either direction” calls.
Column descriptions
- Chrom: Name of the chromosome
- ChromStart: The starting position of the feature in the chromosome
- ChromEnd: The ending position of the feature in the chromosome
- Name: Name
- Score: Z score based on mean(logFC of all the bins)
- Strand: Strand
- Group: Assay name
- ASTARR = ATAC-STARR
- WSTARR = Whole genome (WHG)-STARR
- LMPRA = Lenti-MPRA
- TMPRA = Tiling MPRA
- Label: Assay name + direction (A/R)
- A: enhancer calls (
merged_enhancer_peaks_in_either_orientation.bed.gz) - R: repressive calls (
merged_repressor_peaks_in_either_orientation.bed.gz)
- A: enhancer calls (
- Dataset: Assay dataset
- TR = Reddy lab (Tim Reddy); ATAC-STARR and WHG-STARR
- Nadav = Ahituv lab (Nadav Ahituv); Lenti-MPRA
- OL = dataset label from Tewhey lab; Tiling MPRA
Summary counts
I am using the merged peak files of in_either_orientation in Junke peak files.
| Assay | Active (A) | Repressive (R) |
|---|---|---|
| ATAC-STARR-seq | 35,505 | 154,337 |
| WHG-STARR-seq | 79,738 | 62,201 |
| Lenti-MPRA | 25,648 | 485 |
| Tiling-MPRA | 6,017 | 254 |
| eSTARR-seq | 150 | 341 |
Applying ChIP-seq differential peak calling (csaw) on ATAC-STARR-seq assay
The csaw tool was utilized for differential peak calling in ATAC-STARR assay data to identify cis-regulatory element from the chromatin accessible regions. This process was conducted by Alex.
KS91 (6Dna4Rna) -> KSMerge (6Dna7Rna)
Number of significant regions increased. Negative regions increased more than positive regions.

Total number of regions:
352,944 -> 359,104

Significant regions (-log10Q >= 3):
87,695 -> 93,208

Percentage of negative and positive:
- Postive: 0.61 (53110) -> 0.53 (49041)
- Negative: 0.39 (34585) -> 0.47 (44167)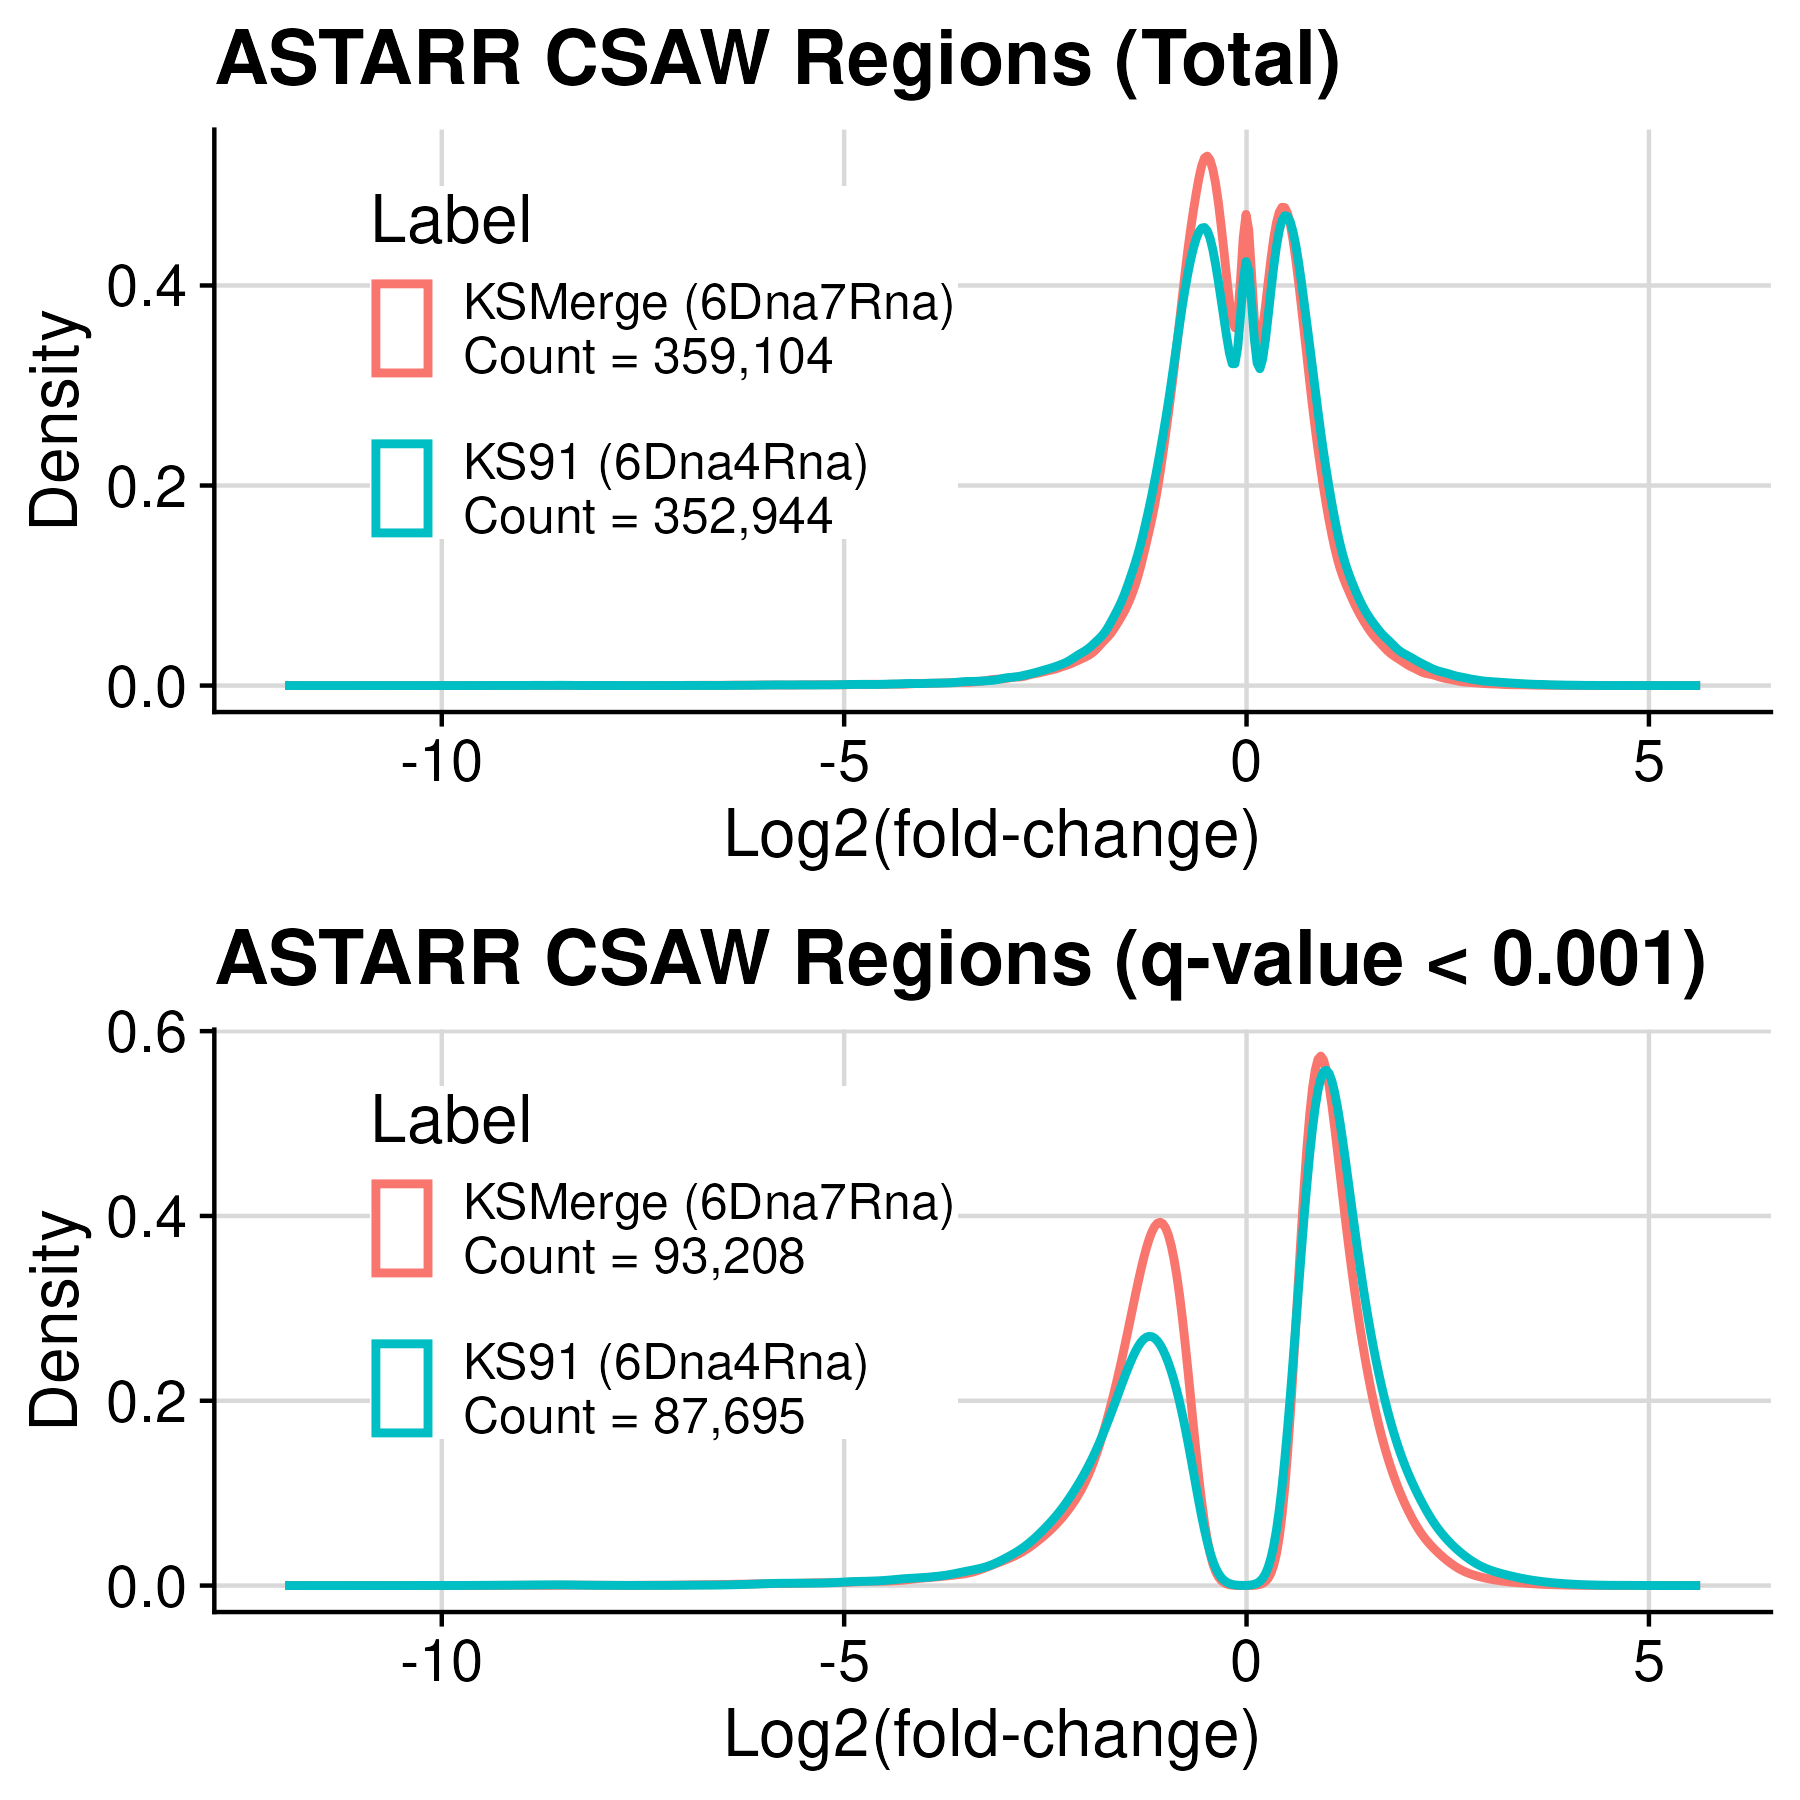
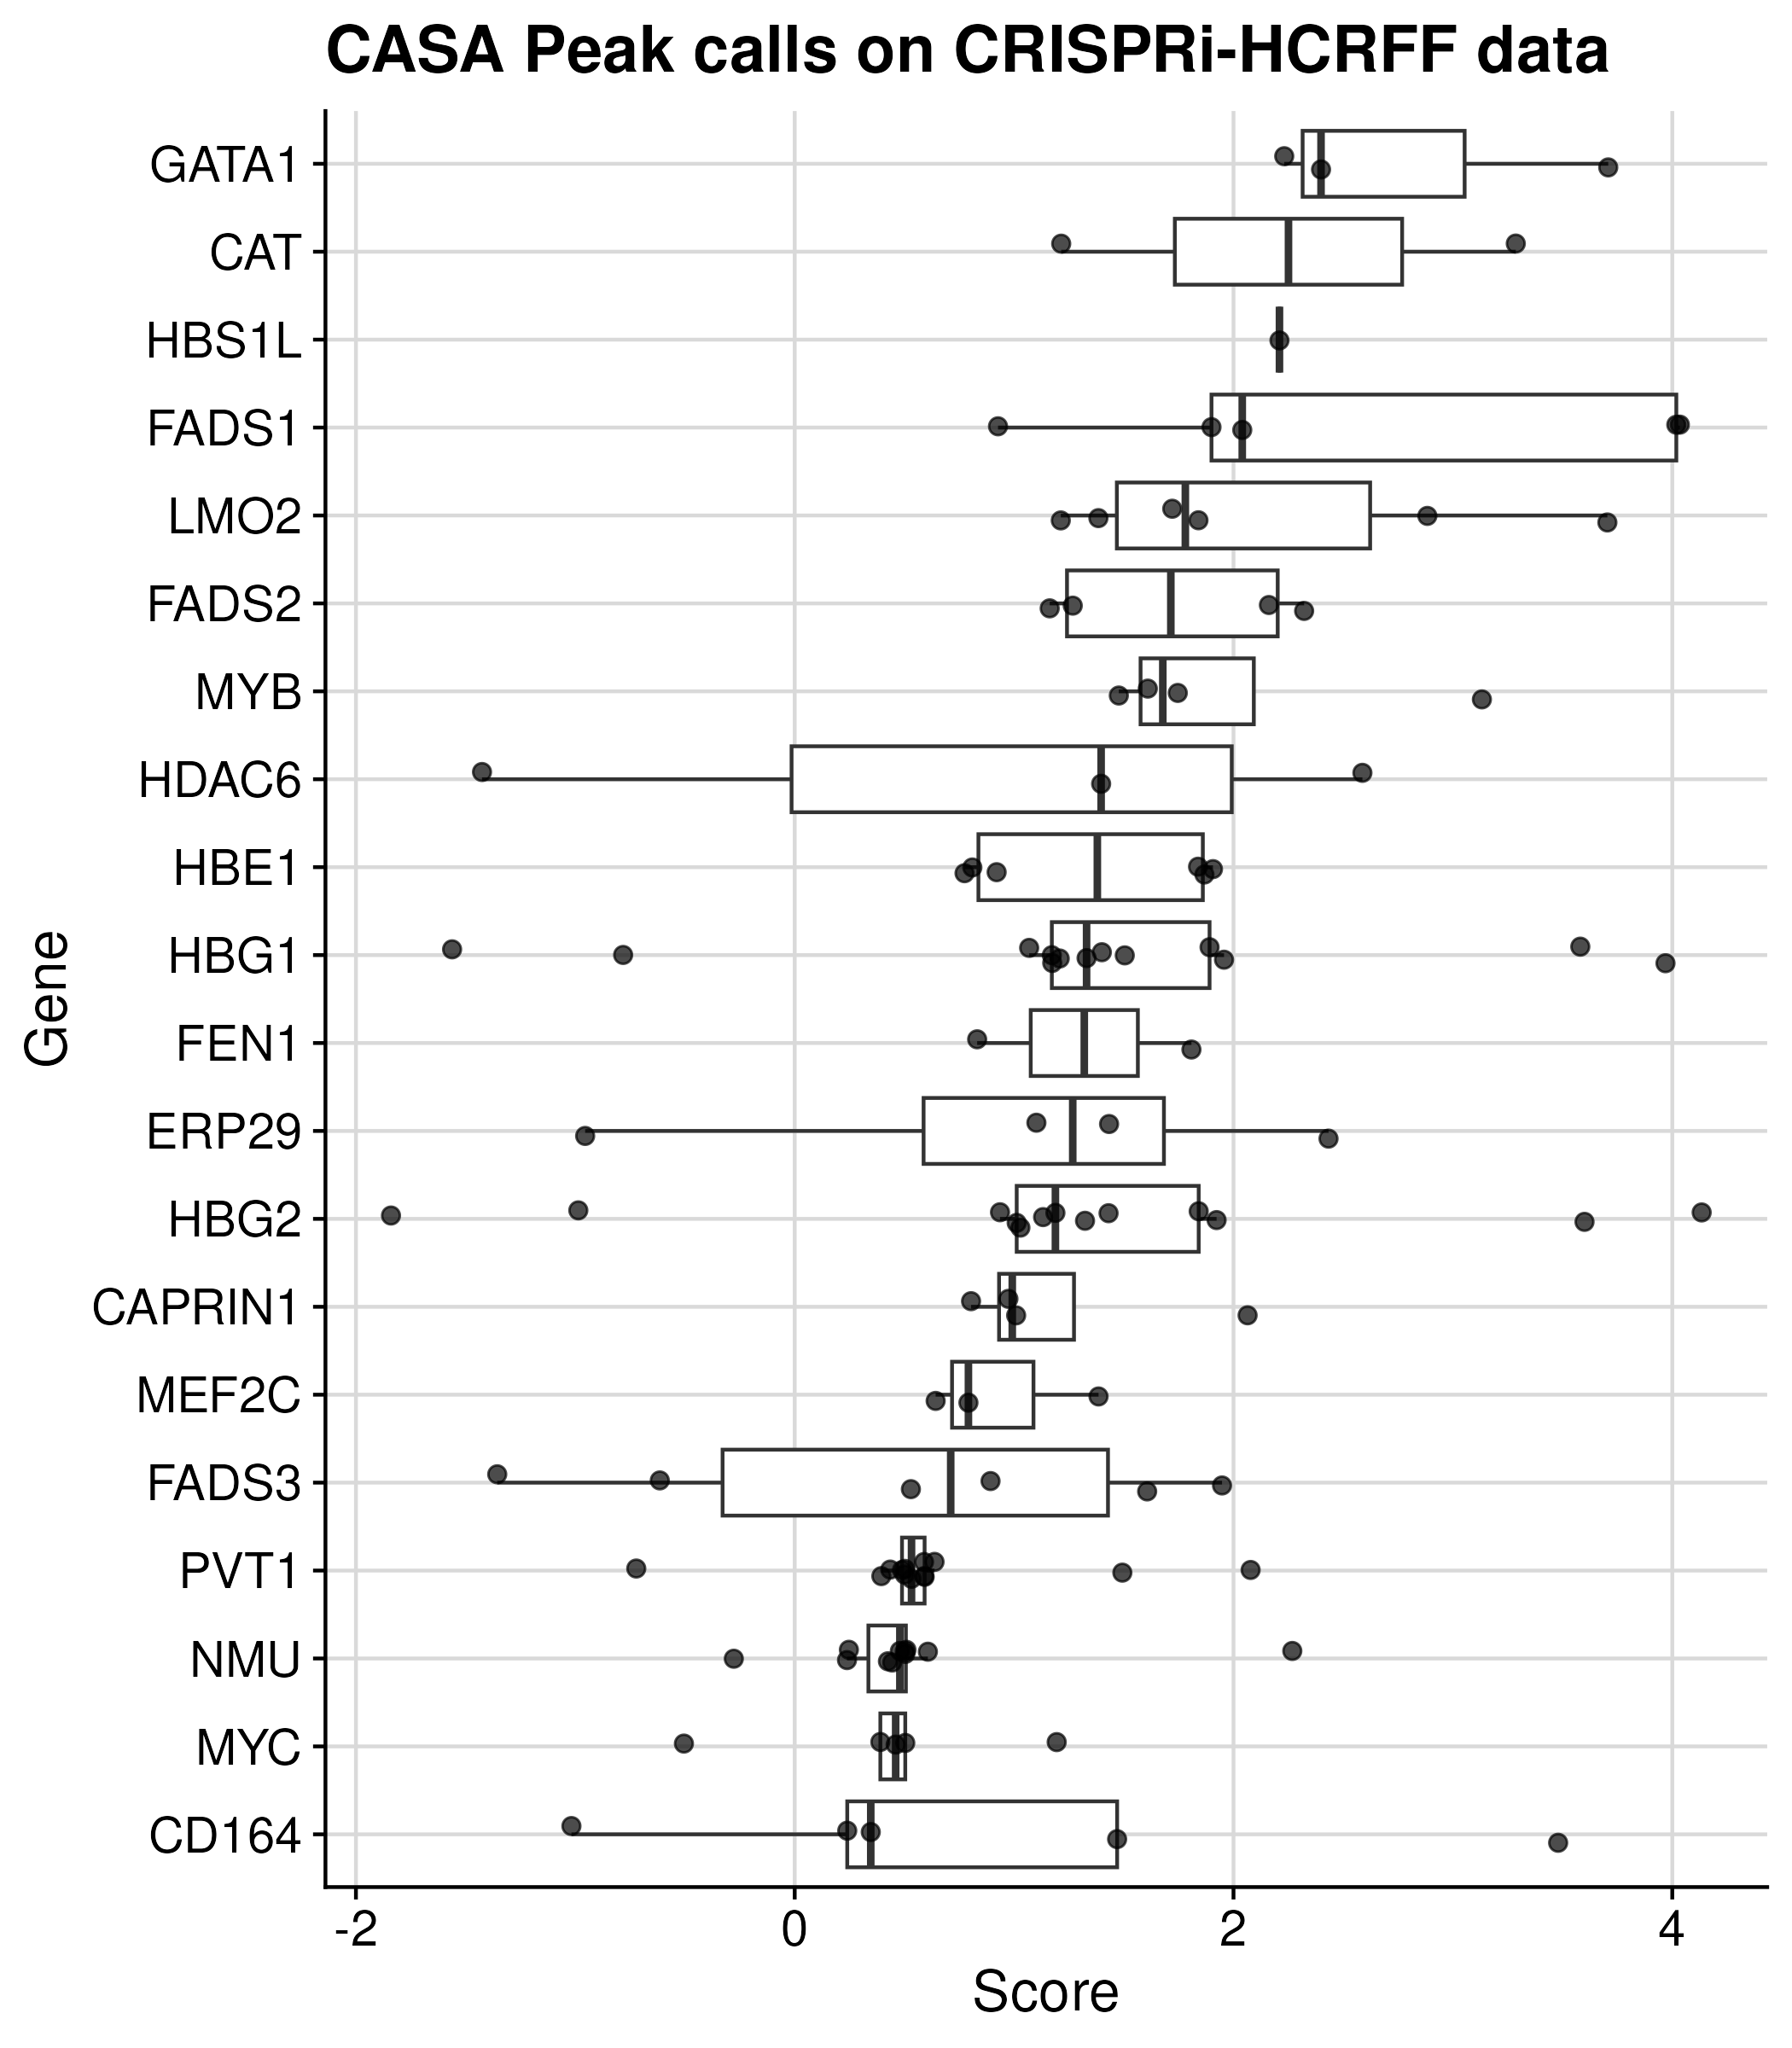
CRISPR activity screen analysis (CASA) on CRISPRi-HCR Flow-FISH data
The CASA analysis pipeline, developed by the Sabeti Lab, has been applied to CRISPRi-HCR Flow-FISH data to identify regulatory elements. The results of significant regions can be downloaded from the ENCODE portal as follows:
The table is downloaded by ENCODE FCC CRSIRPi HCR FlowFISH
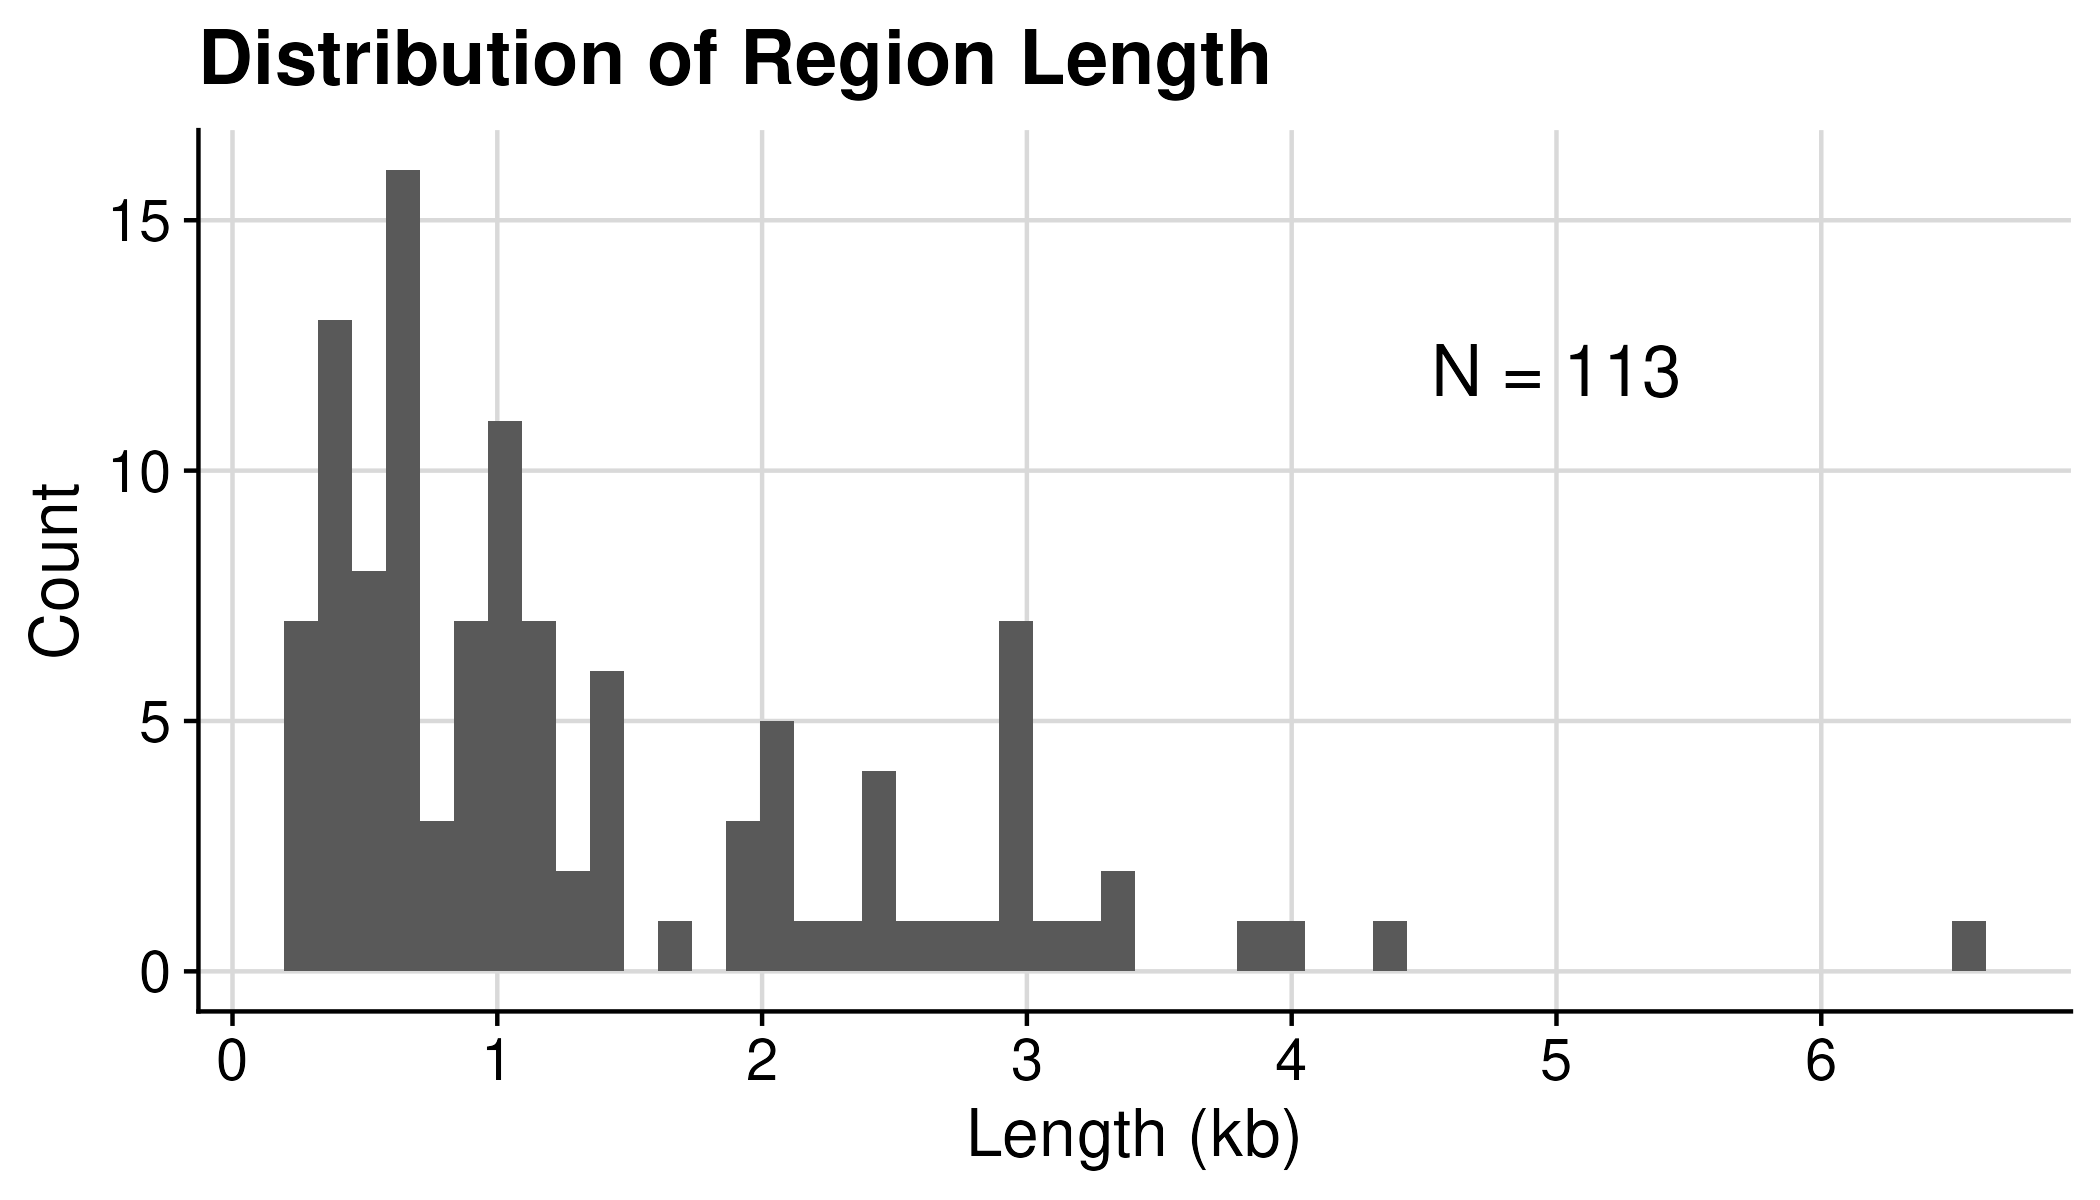
Calling DHS regions using DESeq analysis for CRISPRi-Growth
For the analysis of CRISPRi-Growth data, DHS (DNase I hypersensitive sites) regions with significant effect on cell fittness have been identified using DESeq analysis, performed by Alex.
There are ~ 1M (1,092,166) guides designed to screen across ~111K (111,702) DHS regions in K562.
Method: DESeq2 analysis on all guides -> log2 foldchange and p-values
Significant: Guide with fdr_0_05
We got 6424 DHS regions containing at least one significant guides.
#Guide  (Total):      1092166
#Region (Total):      111702
#Guide  (padj<=0.05): 8200
#Region (padj<=0.05): 6242

#Guide  (Signif): 6242
#Region (Signif): 6242 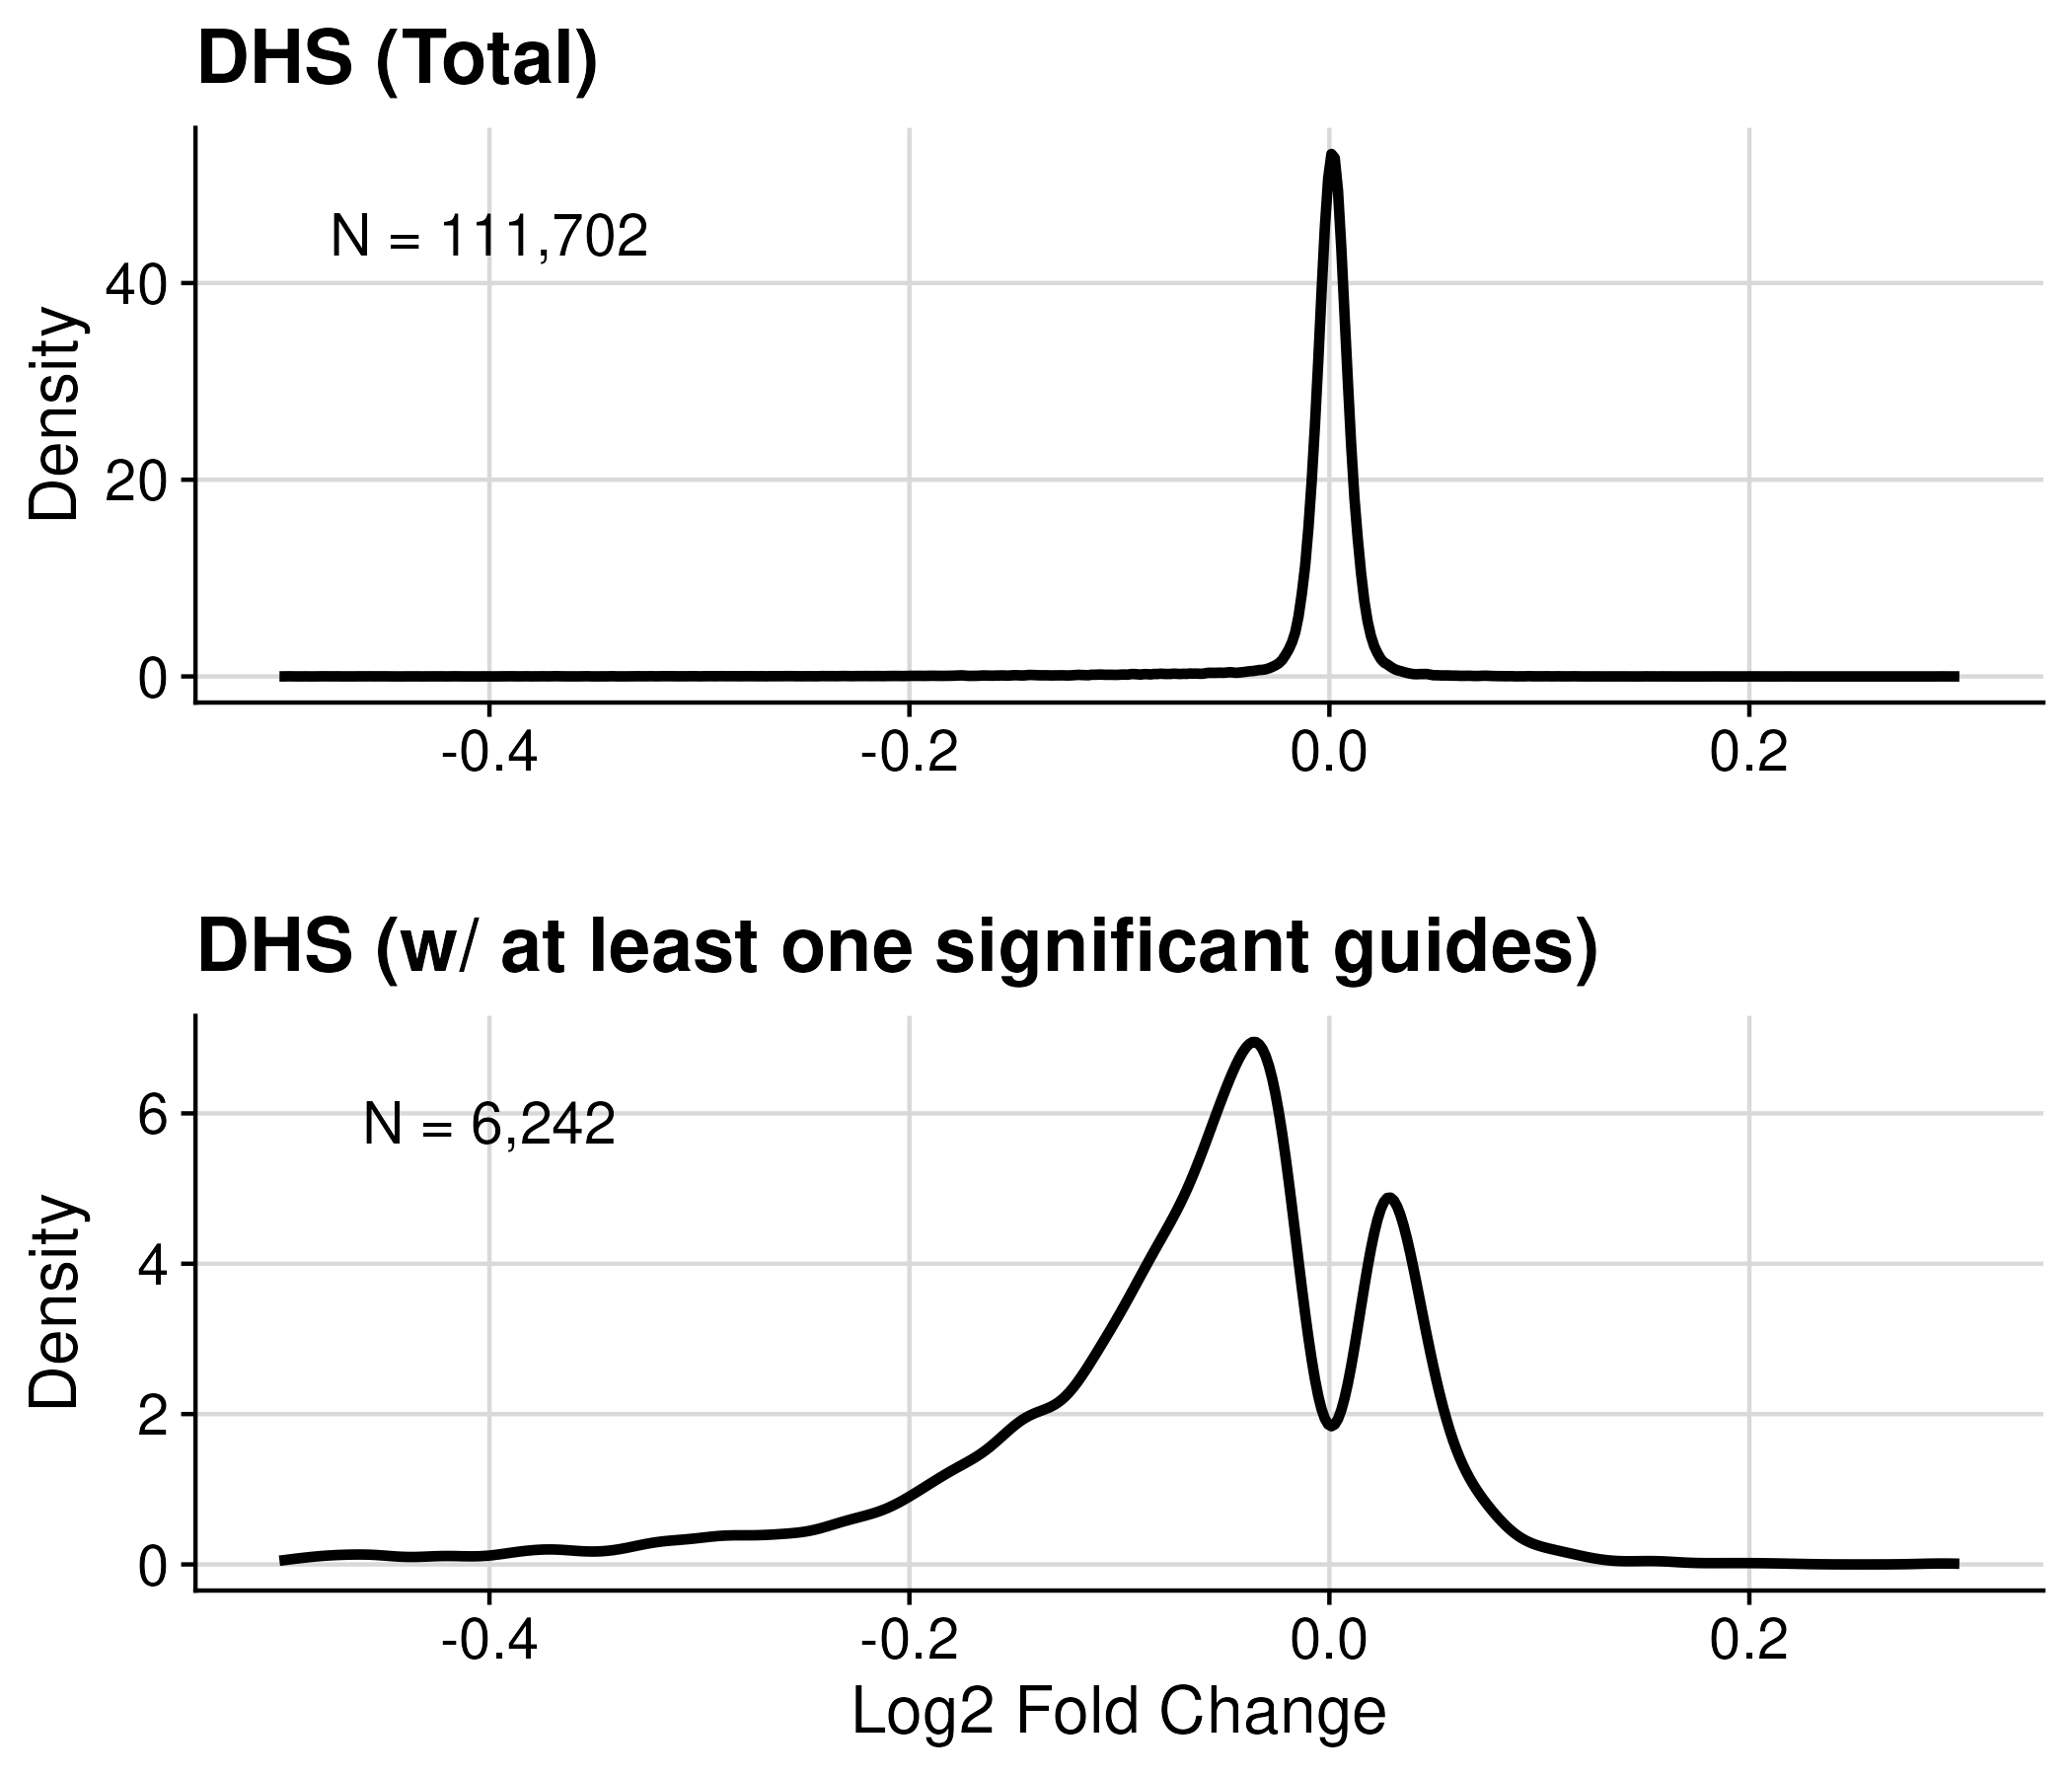
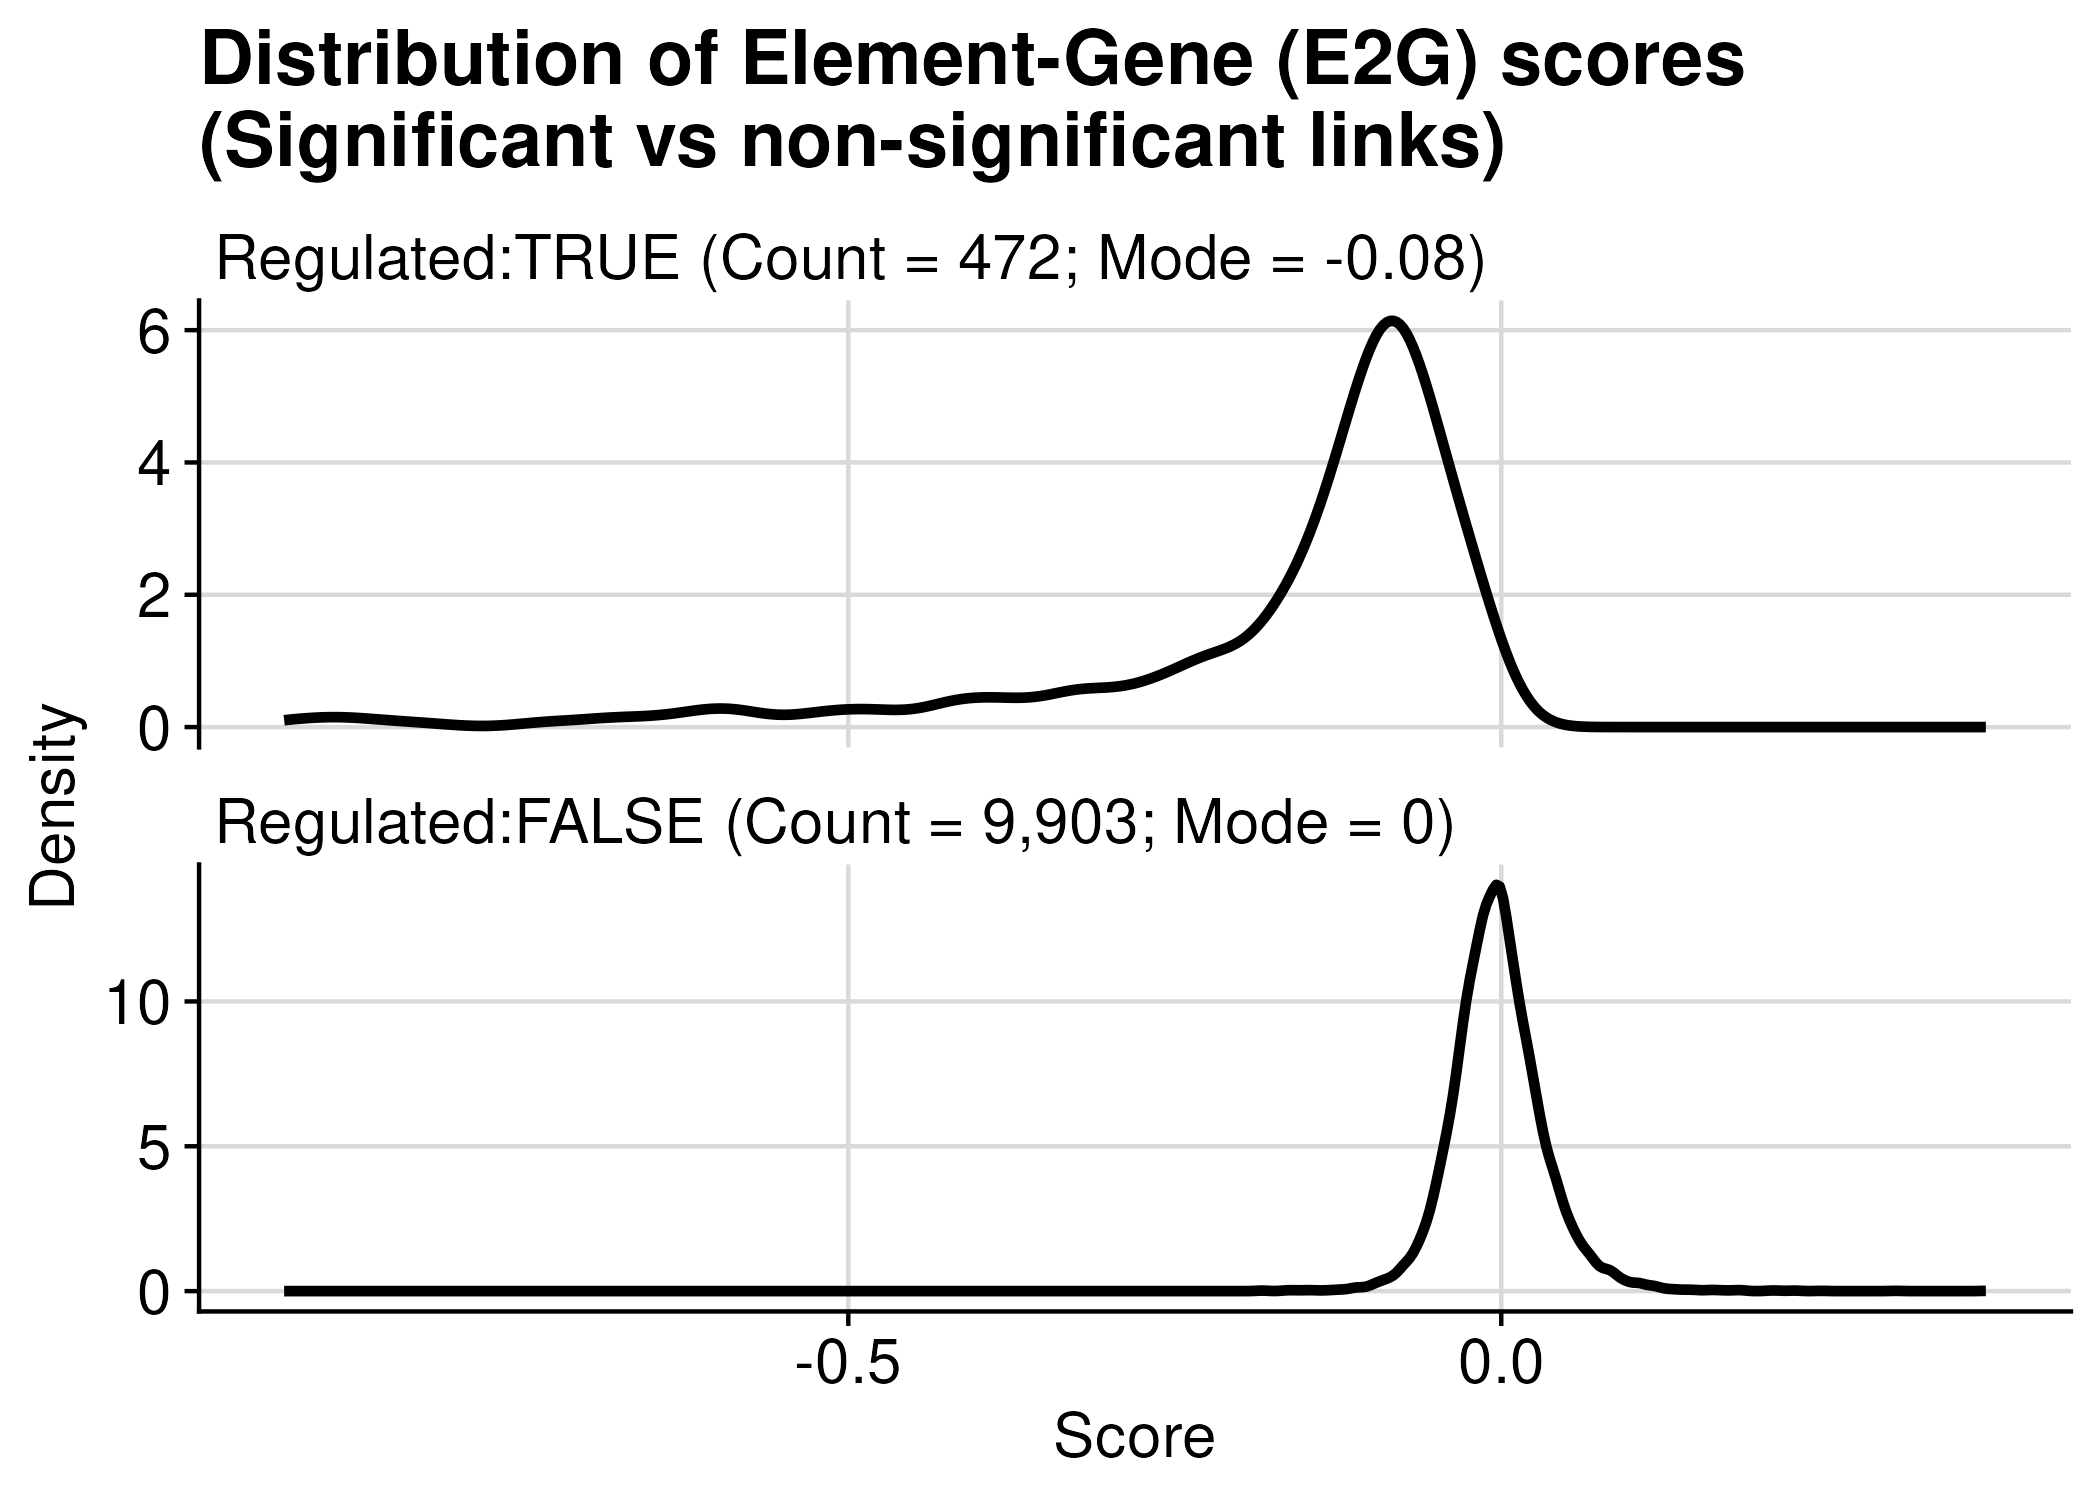
ENCODE E2G Benchmark data
Build ENCODE E2G model
Logistic regression
Train and test the E2G model using their collected “gold standard” dataset
- 10,375 total element-gene pairs collected from previous studies.
- 472 “positive” unique element-gene pairs
- 9,903 “negative” element-gene pairs
To train and evaluate models, we aggregated a gold-standard dataset of 10,411 element-gene pairs tested with CRISPR in K562 erythroleukemia cells, an ENCODE Tier 1 cell line. We re-analyzed and harmonized data from previous studies that used genetic perturbations (mostly CRISPR interference (CRISPRi)) to inhibit candidate enhancers and measure effects on gene expression 9,19,23–25 (see Note S1). Importantly, we developed approaches to compute statistical power for every tested element-gene pair, identifying 472 “positive” unique element-gene pairs where CRISPR perturbation of the element led to a significant decrease in gene expression (–1 to –93% effects, Fig. S1.1f) and 9,938 “negative” element-gene pairs where no significant reduction in expression was observed despite the experiment having good power to detect >15-25% effects on gene expression (Note S1). We trained logistic regression classifiers to distinguish positives from negatives using hold-one-chromosome-out cross-validation. Then, we applied the trained model to all element-gene pairs across the genome and to new cell types.
Biosample: K562
Reference
Ulirsch2016
Gasperini et al., 2019
Wakabayashi2016
Schraivogel et al., 2020
Klann2017
Thakore2015
Xie2017
Fulco2019
Qi2018
Huang2018
Xu2015
Fulco2016
Source Count
Fulco2016: 103
Fulco2019: 3501
Gasperini et al., 2019: 5318
Schraivogel et al., 2020: 1306