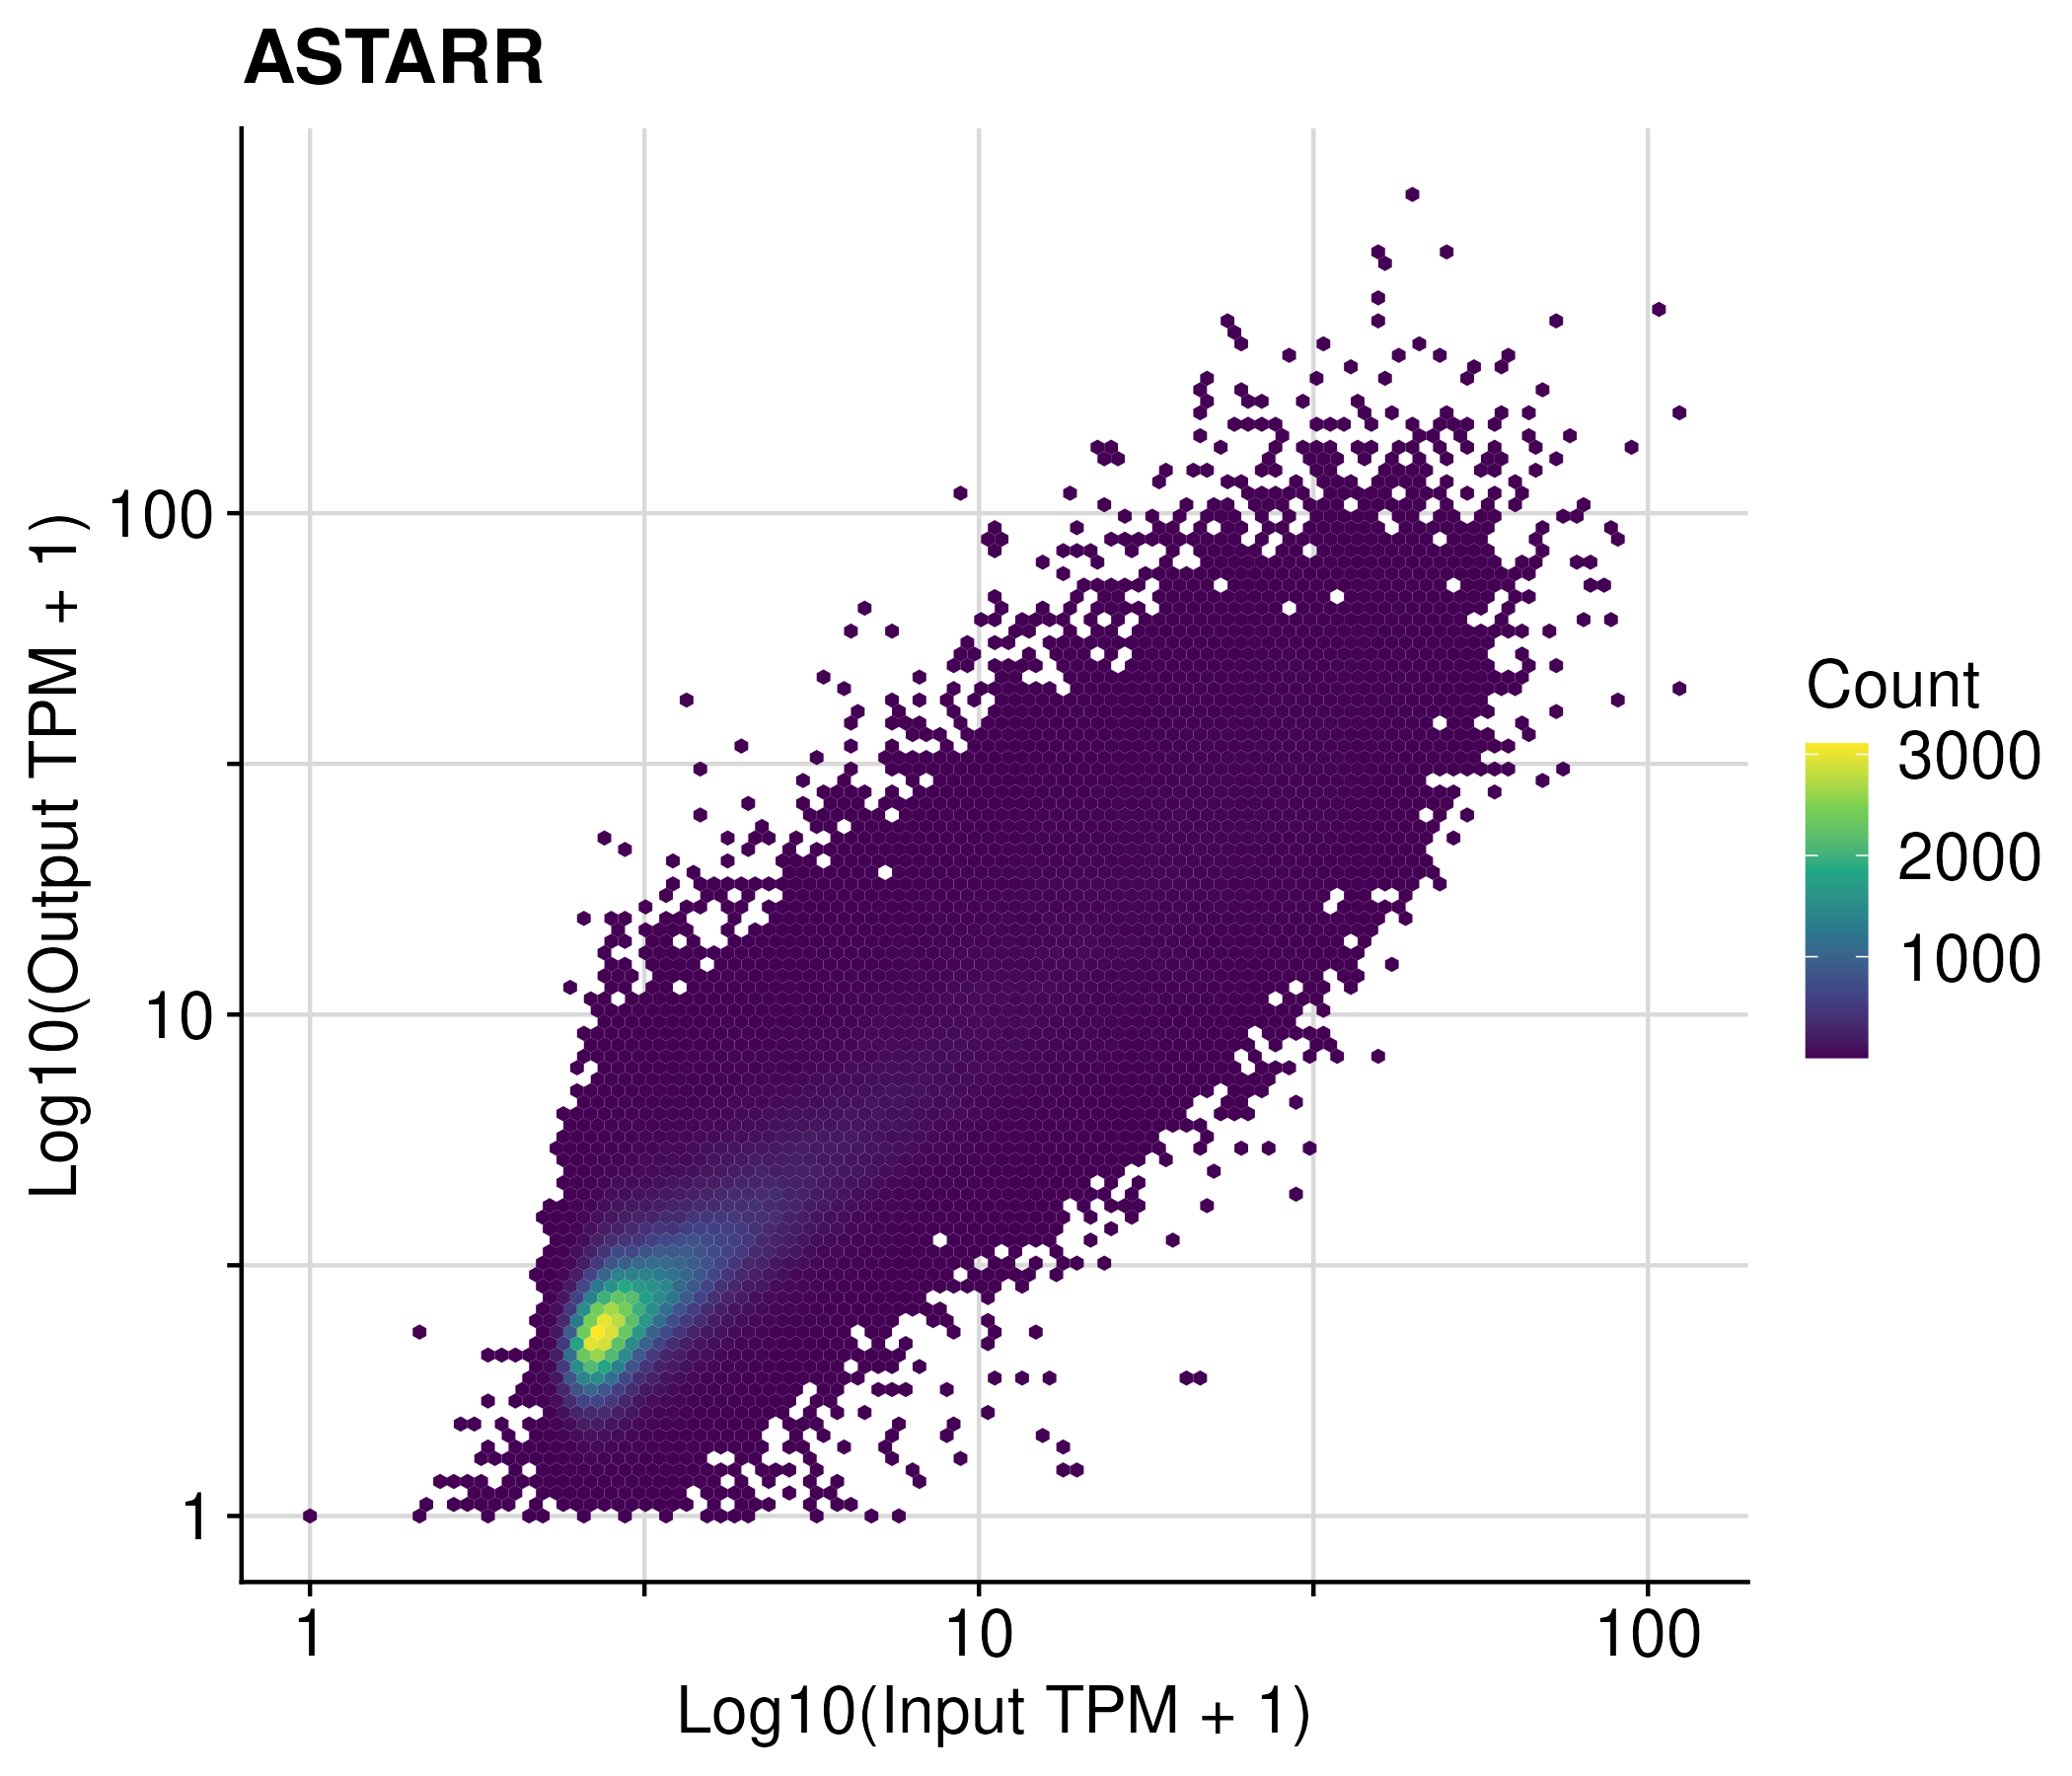
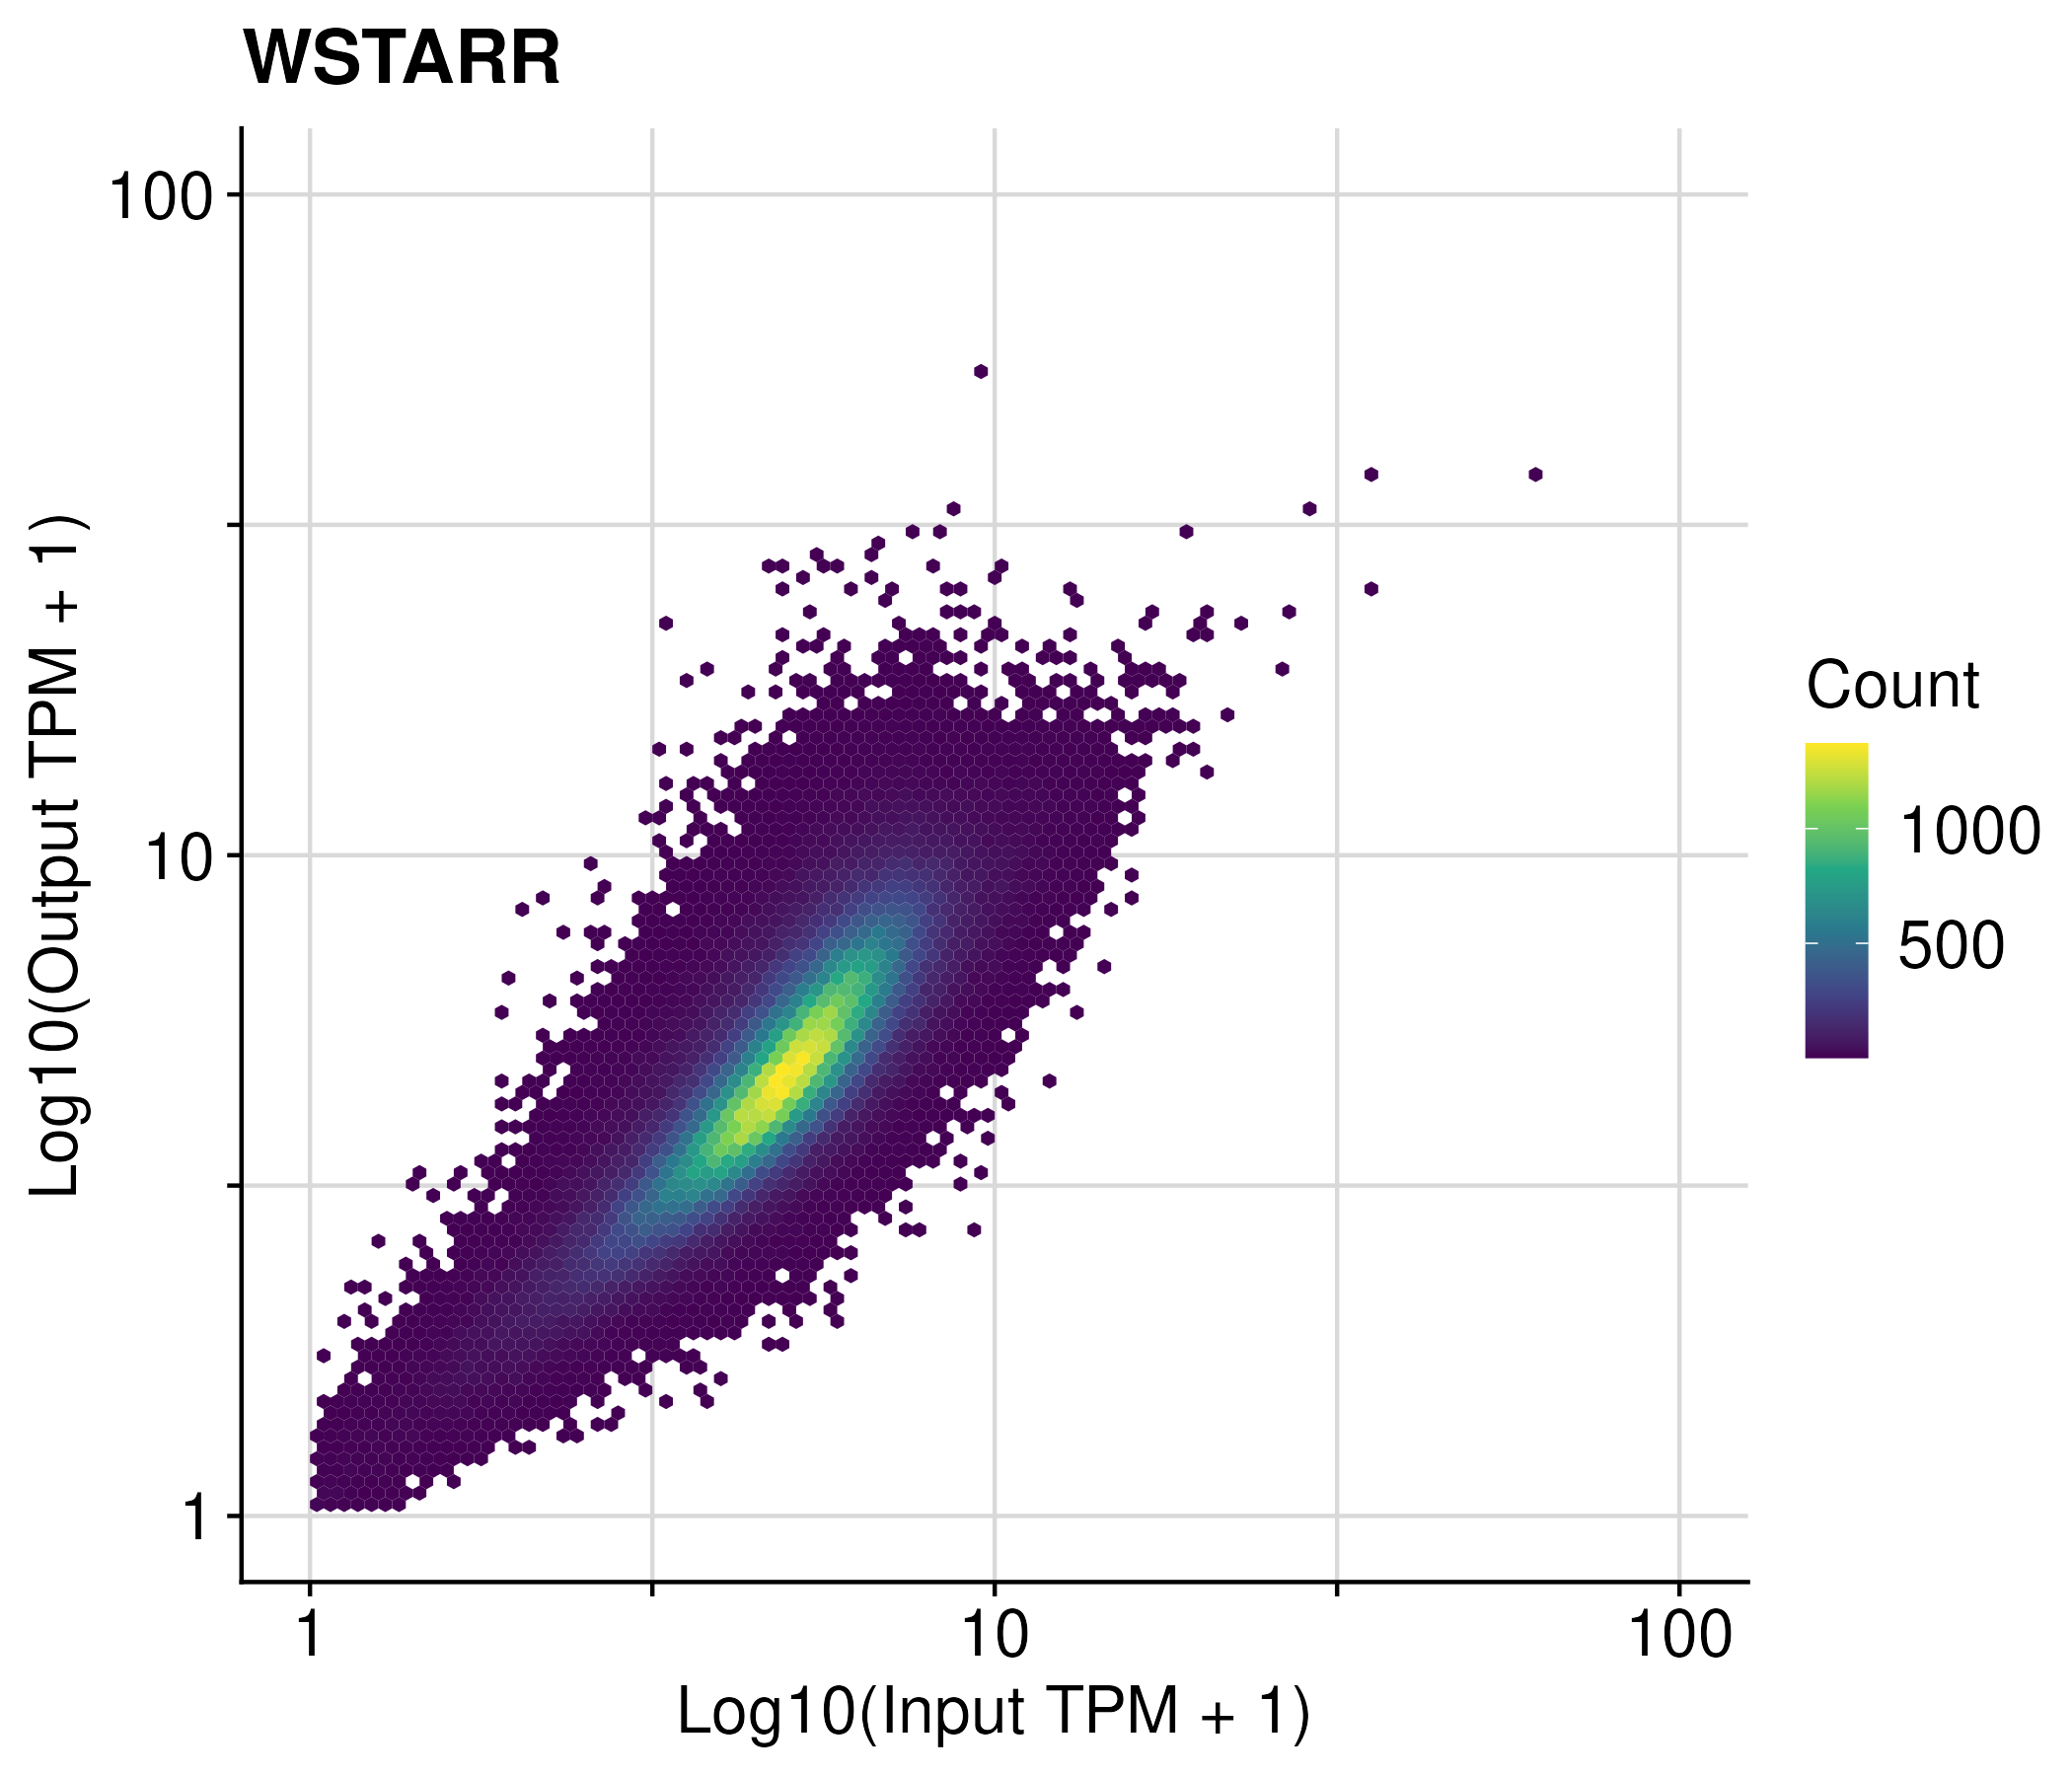
FCC coverage at ATAC/DHS regions
STARR-seq and Tiling MPRA
fragment counts across accessible regions
regions with extreme low fragments were filtered using EdgeR
the log2 fold change of each regions were calculated using DEseq2
The z score is calculated by standardizing the log2 fold change.
Lenti-MPRA
The log2 fold change were acquired from the Agarwal et al., 2025. The z score is calculated by standardizing the log2 fold change.
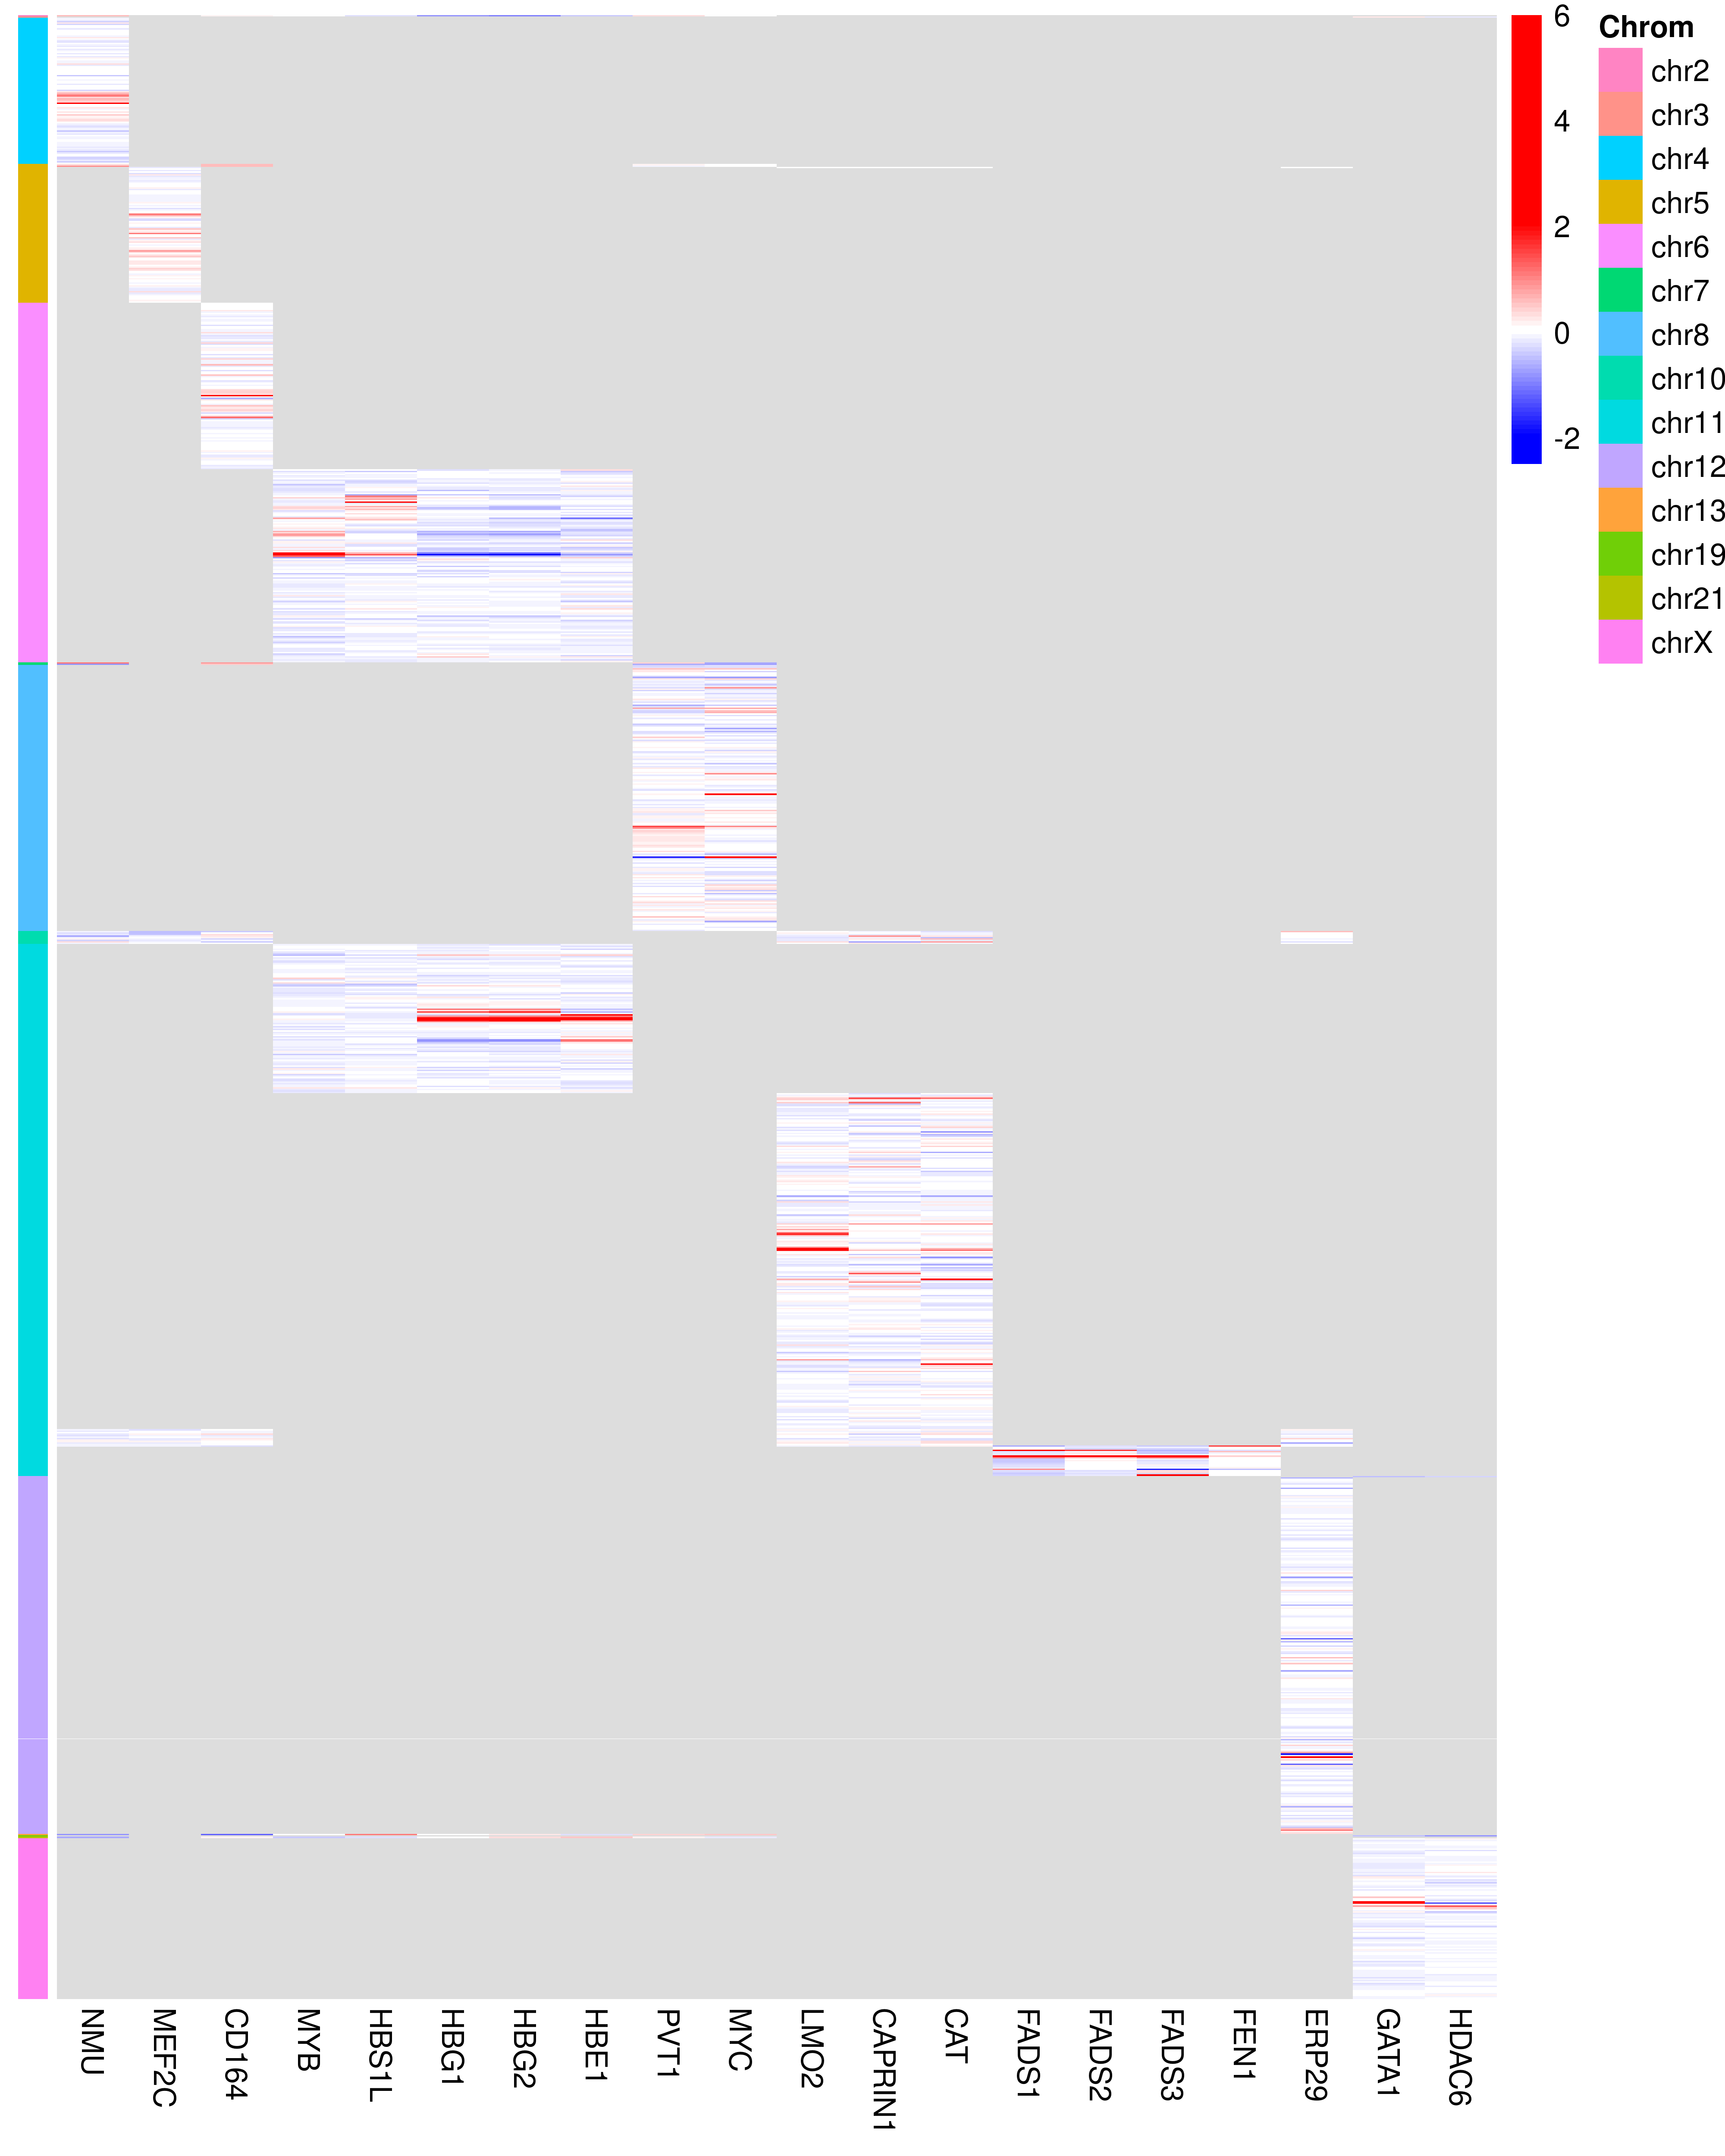
CRISPRi-HCR FlowFISH
The log2 fold change of guides were standardized to z scores for each target respectively.
The mean of z scores were calculated for each target across accessible regions by excluding safe-targeting guides.
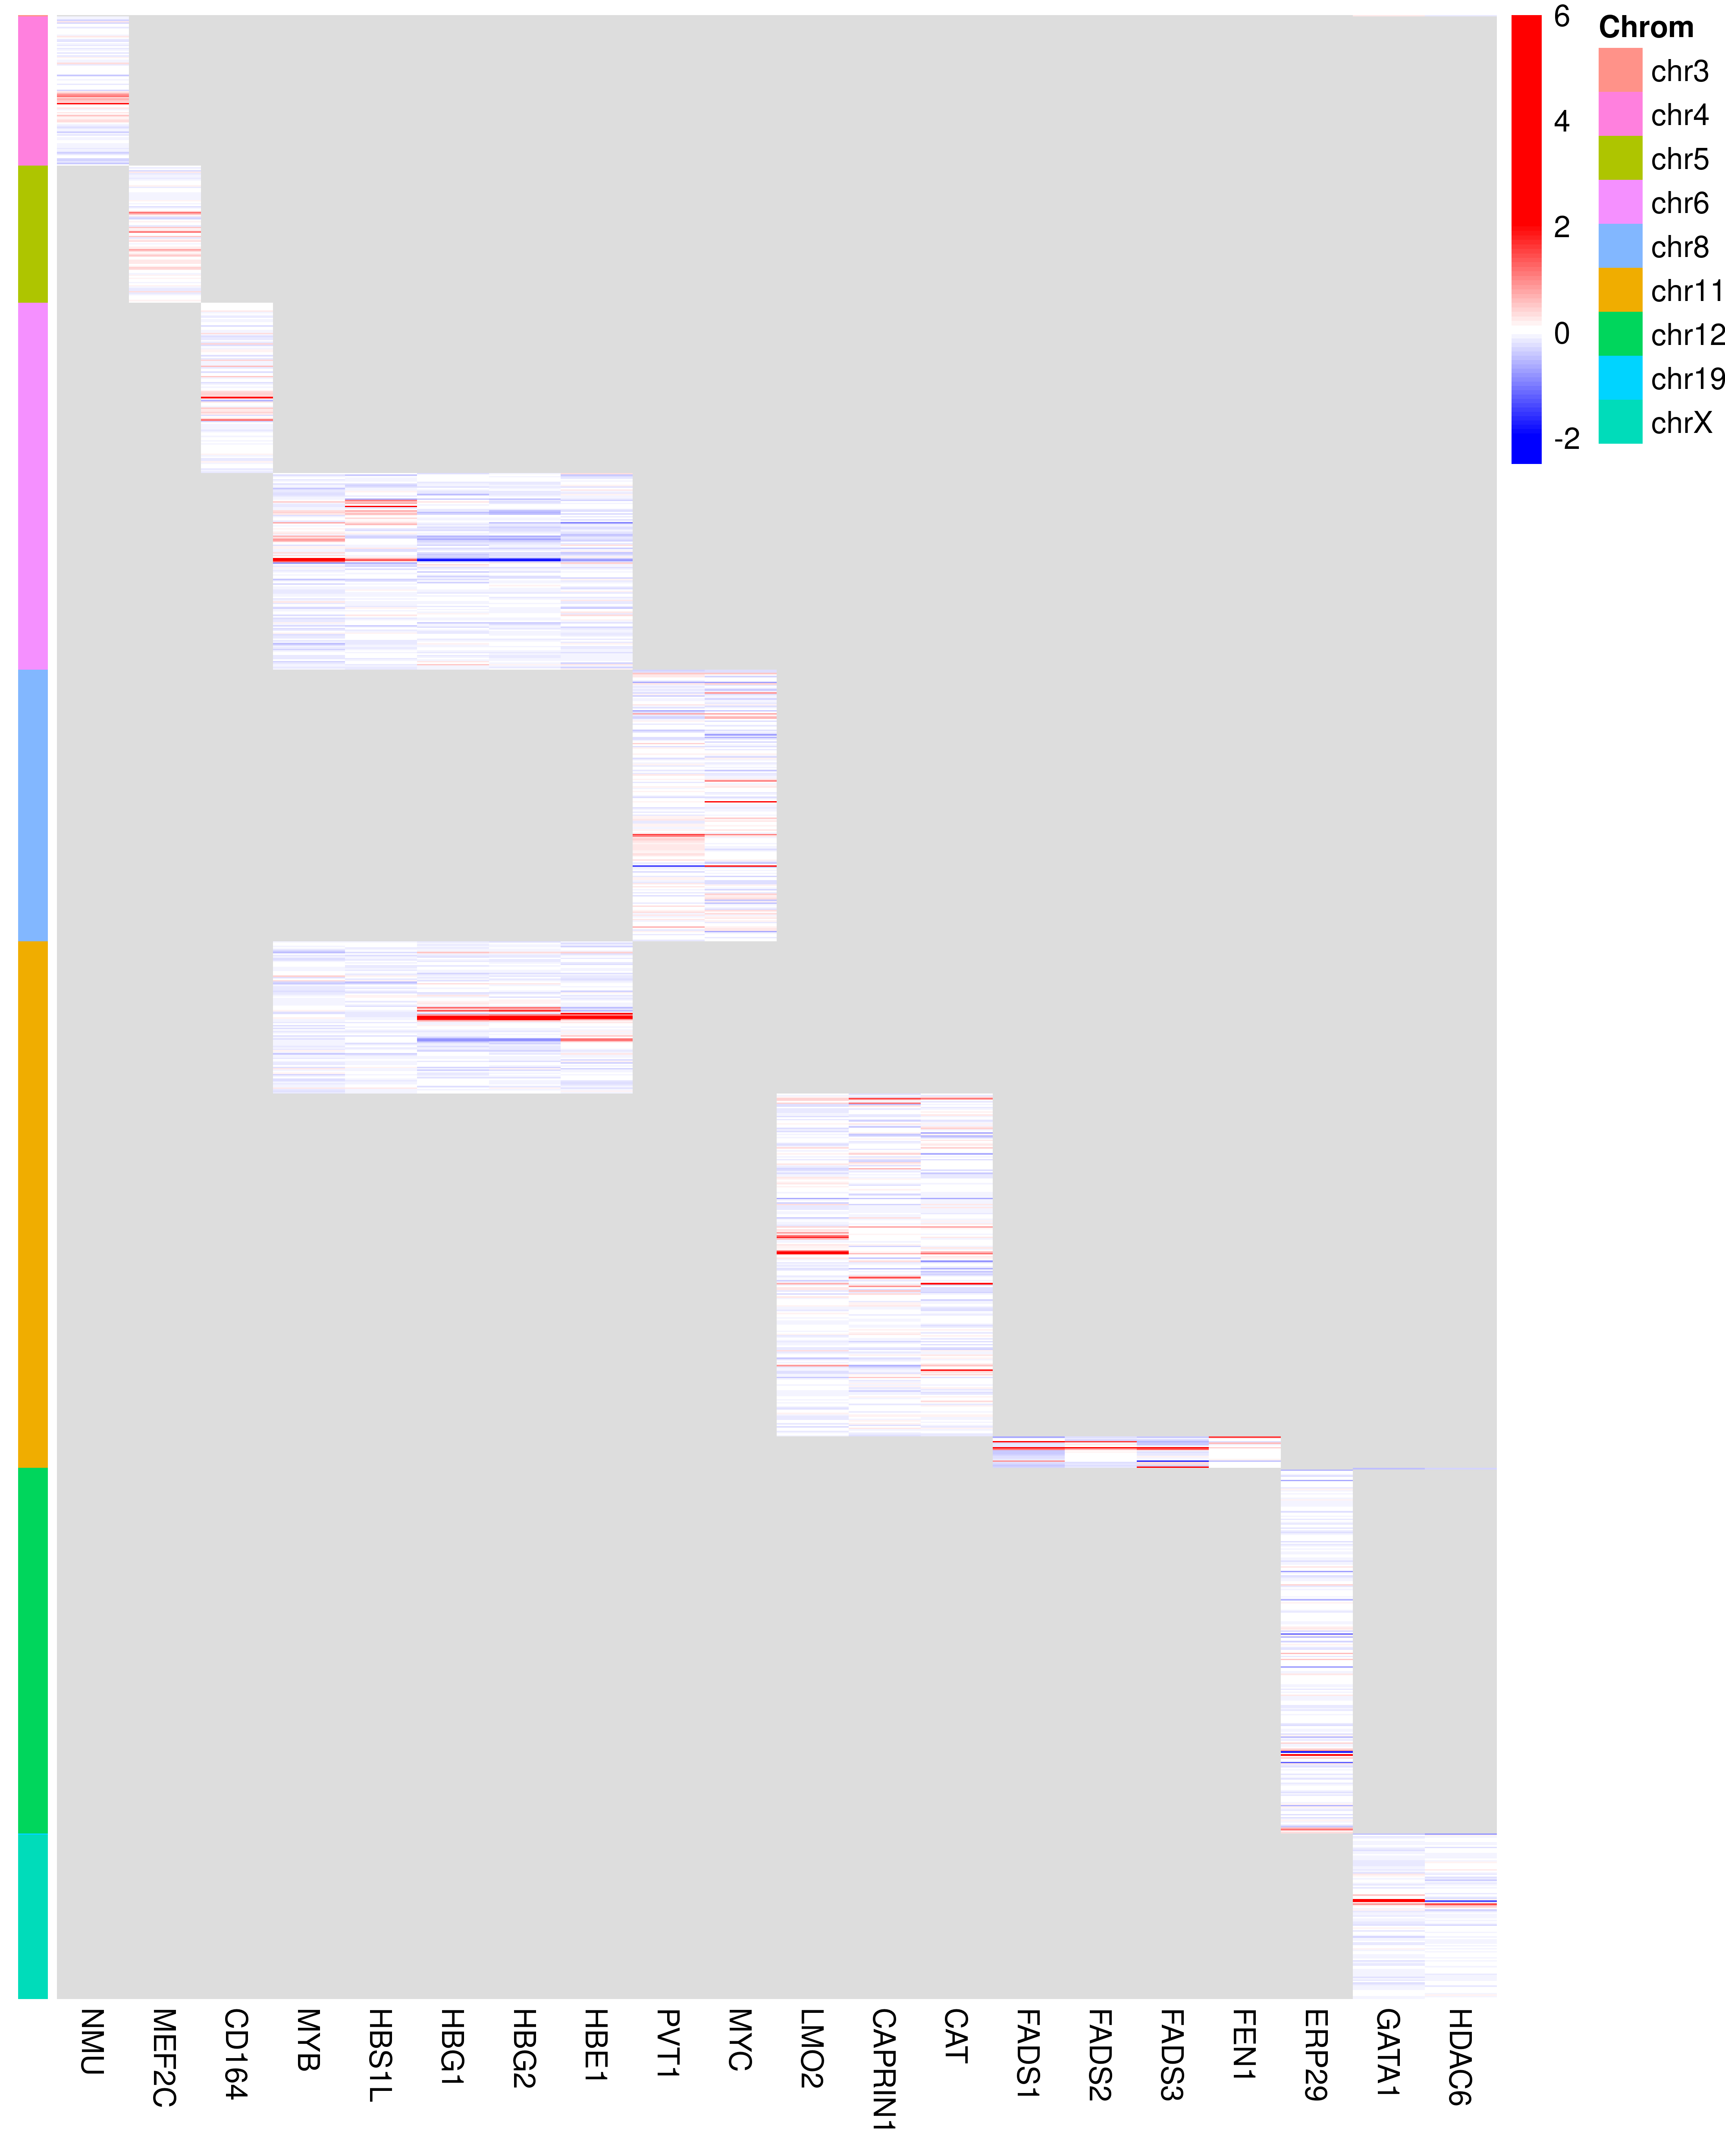
Coverage of CRISPRi-HCR FlowFISH across accessbile regions:
Safe-targeting guides Removed:
CRISPRi-Growth screen
The log2 fold change of guides were standardized to z scores
The mean of z scores were calculated for each target across accessible regions.
Summarize region coverage
Genome coverage of FCC assays
| Assay | ATAC (Overlap) | ATAC (Union) |
|---|---|---|
| ATAC | 150,041 | 246,852 |
| ASTARR | 150,040 | 246,850 |
| WSTARR | 146,594 | 241,031 |
| CRISPRi-Growth | 72,743 | 80,288 |
| LMPRA | 61,478 | 68,497 |
| TMPRA | 1,148 | 1,722 |
| CRISPRi-HCRFF | 925 | 1,330 |
Table: ratio = divided by total ATAC
Set ATAC as 100%; how many percentage of regions are screened by each assay?
| Assay | ATAC (Overlap) | ATAC (Union) |
|---|---|---|
| ASTARR | 100% | 100% |
| WSTARR | 98% | 98% |
| CRISPRi-Growth | 48% | 33% |
| LMPRA | 41% | 28% |
| TMPRA | 0.8% | 0.7% |
| CRISPRi-HCRFF | 0.6% | 0.5% |