Set environment
Code
suppressMessages (suppressWarnings (source ("../run_config_project_sing.R" )))show_env ()
You are working on        Singularity: singularity_proj_encode_fcc
BASE DIRECTORY (FD_BASE): /data/reddylab/Kuei
REPO DIRECTORY (FD_REPO): /data/reddylab/Kuei/repo
WORK DIRECTORY (FD_WORK): /data/reddylab/Kuei/work
DATA DIRECTORY (FD_DATA): /data/reddylab/Kuei/data

You are working with      ENCODE FCC
PATH OF PROJECT (FD_PRJ): /data/reddylab/Kuei/repo/Proj_ENCODE_FCC
PROJECT RESULTS (FD_RES): /data/reddylab/Kuei/repo/Proj_ENCODE_FCC/results
PROJECT SCRIPTS (FD_EXE): /data/reddylab/Kuei/repo/Proj_ENCODE_FCC/scripts
PROJECT DATA    (FD_DAT): /data/reddylab/Kuei/repo/Proj_ENCODE_FCC/data
PROJECT NOTE    (FD_NBK): /data/reddylab/Kuei/repo/Proj_ENCODE_FCC/notebooks
PROJECT DOCS    (FD_DOC): /data/reddylab/Kuei/repo/Proj_ENCODE_FCC/docs
PROJECT LOG     (FD_LOG): /data/reddylab/Kuei/repo/Proj_ENCODE_FCC/log
PROJECT REF     (FD_REF): /data/reddylab/Kuei/repo/Proj_ENCODE_FCC/references
Set global variable
Code
= "encode_rnaseq"
Import data
Code
= TXT_FOLDER= file.path (FD_DAT, "external" , txt_folder)= dir (txt_fdiry)for (txt in vec){cat (txt, " \n " )}
checksum_md5sum.txt
checksum_results.txt
K562.hg38.ENCSR615EEK.ENCFF421TJX.RNAseq_total.tsv
K562.hg38.ENCSR615EEK.ENCFF585HTZ.RNAseq_total.strand_pos.bw
K562.hg38.ENCSR615EEK.ENCFF876JOV.RNAseq_total.strand_neg.bw
run_download_files.log.txt
run_download_files.sh
run_download.log.txt
tmp
Code
### set file path = TXT_FOLDER= file.path (FD_DAT, "external" , txt_folder)= "K562.hg38.ENCSR615EEK.ENCFF421TJX.RNAseq_total.tsv" = file.path (txt_fdiry, txt_fname)### read table = read_tsv (txt_fpath, show_col_types = FALSE )### show and assign = datprint (dim (dat))fun_display_table (head (dat))
10904
10904
93
0
0
0
0
0
0
0
0
0
0
0
0
0
0
12954
12954
94
0
0
0
0
0
0
0
0
0
0
0
0
0
0
12956
12956
72
0
0
0
0
0
0
0
0
0
0
0
0
0
0
12958
12958
82
0
0
0
0
0
0
0
0
0
0
0
0
0
0
12960
12960
73
0
0
0
0
0
0
0
0
0
0
0
0
0
0
12962
12962
72
0
0
0
0
0
0
0
0
0
0
0
0
0
0
Explore data
Show distribution of gene expression
Code
= dat_rnaseq_importsummary (dat$ TPM)
     Min.   1st Qu.    Median      Mean   3rd Qu.      Max.
     0.00      0.00      0.00     16.80      0.54 152445.71
Code
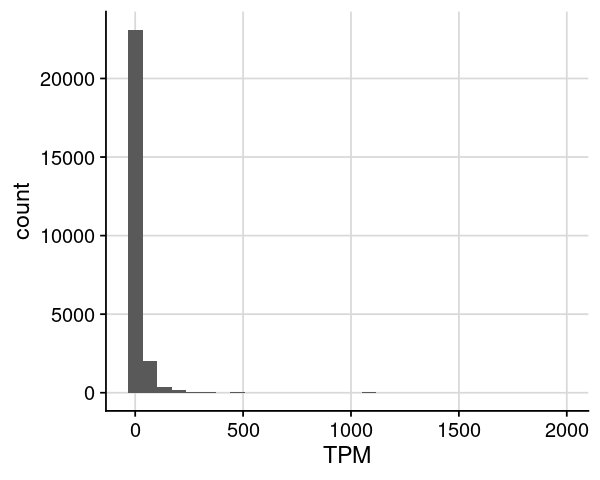
= dat_rnaseq_import= dat %>% dplyr:: filter (TPM > 0 , TPM <= 2000 )= ggplot (dat, aes (x= TPM)) + geom_histogram (bins= 30 ) + theme_cowplot () + background_grid ()options (repr.plot.height= 4 , repr.plot.width= 5 )print (gpt)
Code
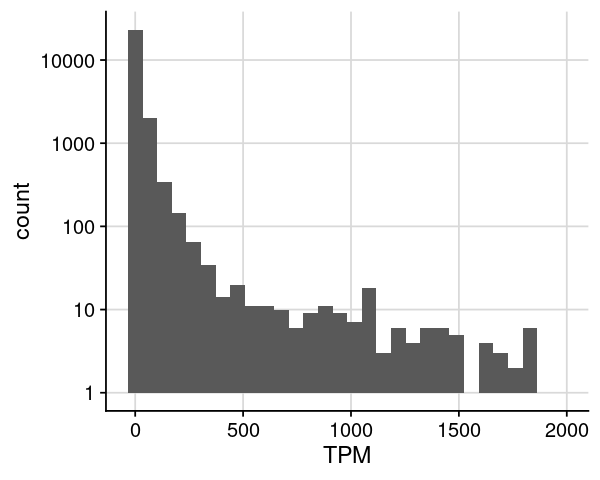
= dat_rnaseq_import= dat %>% dplyr:: filter (TPM > 0 , TPM <= 2000 )= ggplot (dat, aes (x= TPM)) + geom_histogram (bins= 30 ) + scale_y_log10 () + theme_cowplot () + background_grid ()options (repr.plot.height= 4 , repr.plot.width= 5 )print (gpt)
Summary
Number of genes with TPM as zero
Code
### init = dat_rnaseq_import### Total = dat= length (unique (tmp$ gene_id))### TPM == 0 = dat %>% dplyr:: filter (TPM == 0 )= length (unique (tmp$ gene_id))### TMP > 0 = dat %>% dplyr:: filter (TPM > 0 )= length (unique (tmp$ gene_id))### TMP > 1 = dat %>% dplyr:: filter (TPM > 1 )= length (unique (tmp$ gene_id))### show cat ("" ,"#{Gene | Total } =" , num1, " \n " ,"#{Gene | TPM==0} =" , num2, " \n " ,"#{Gene | TPM >0} =" , num3, " \n " ,"#{Gene | TPM >1} =" , num4, " \n "
 #{Gene | Total } = 59526
 #{Gene | TPM==0} = 33608
 #{Gene | TPM >0} = 25918
 #{Gene | TPM >1} = 13184
Save results
Code
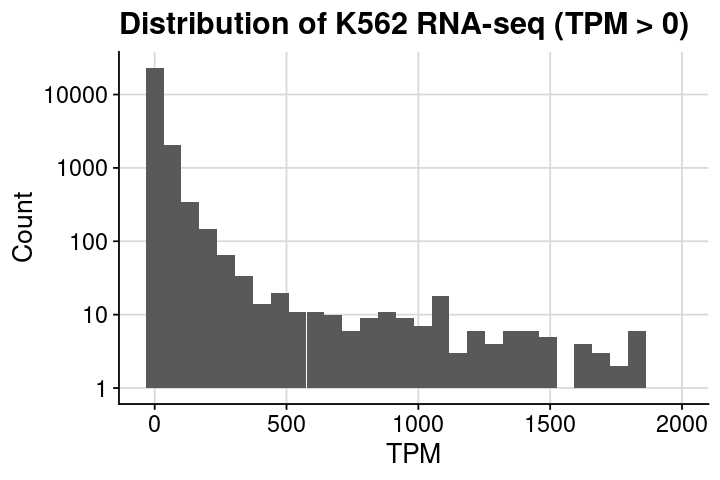
### prepare dataframe = dat_rnaseq_import= dat %>% dplyr:: filter (TPM > 0 , TPM <= 2000 )### set text size = theme (title = element_text (size = 16 ),axis.title = element_text (size = 16 ),axis.text = element_text (size = 14 )### create plot = ggplot (dat, aes (x= TPM)) + geom_histogram (bins= 30 ) + scale_y_log10 () + theme_cowplot () + + background_grid () + labs (x = "TPM" , y = "Count" , title = "Distribution of K562 RNA-seq (TPM > 0)" )### assign and show = gptoptions (repr.plot.height= 4 , repr.plot.width= 6 )print (gpt)
Code
= "./" = "fig.rnaseq.distribution.tpm.nonzero.below2k.png" = file.path (txt_fdiry, txt_fname)ggsave (txt_fpath, gpt_export, height = 4 , width = 6 , units = "in" )
Code
= "./" = "fig.rnaseq.distribution.tpm.nonzero.below2k.svg" = file.path (txt_fdiry, txt_fname)ggsave (txt_fpath, gpt_export, height = 4 , width = 6 , units = "in" )